NYSE CRTR Economy Event Watch the replay →


US Small Cap ETFs
Aggregate data of 43 funds
Performance
Flows
| 1M | 3M | YTD | 1Y | 3Y | 5Y | |
|---|---|---|---|---|---|---|
| Perf. | +0.84% | +12.36% | +15.69% | +32.05% | +52.92% | |
| Flows | -$2.77B | -$621M | -$2.88B | +$220M | +$34.93B | - |
Just published in US Small Cap
There’s an ETF for That? Microcap Stocks
Factor investors interested in the smallest subset of stocks can express a thesis with these microcap ETFs.


Movers in US Small Cap
Data period: June 2 - 9, 2026
Performance lists exclude leveraged and inverse ETFs
Latest news about US Small Cap
There’s an ETF for That? Microcap Stocks
Factor investors interested in the smallest subset of stocks can express a thesis with these microcap ETFs.
MoneyShow Chart of the Day 3/18/2026: Why Wasn't $1 TRILLION Enough?
A trillion-dollar forecast, and the market barely blinked. welcome to the moment when even Nvidia needs more than hype to move the needle.

MoneyShow Chart of the Day 3/9/2026: Tallying Up the Costs in Oil Markets
Oil’s biggest surge since 1983. Now the economic bill is coming due

MoneyShow Chart of the Day 2/2/2026: The Wildest Week in Metals Ever?
Silver just delivered a historic gut punch. A once-in-a-generation price swing that reminded traders and investors alike how violent precious-metal bull markets can get.

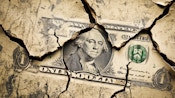
MoneyShow Chart of the Day 1/28/2026: The Greenback is on the Brink...Again
What looks like a routine pullback in the dollar may be something far bigger.
MoneyShow Chart of the Day 1/21/2026: The "Sell America" Trade is Back. Will it Stick?
The Sell America trade is back. Everything dollar-linked is getting dumped, and gold is screaming risk-off.

My Contrarian Equity ETF Picks For 2026
Here’s my analysis of some notable overlooked and out-of-favor ETFs that could rebound in 2026.

MoneyShow Chart of the Day 11/12/2025: With the Shutdown Behind Us, Will the Bulls Take Over?
Turns out, when Congress clocks out, the market clocks in.

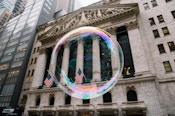
MoneyShow Chart of the Day 11/06/2025: How Worried Should You REALLY be About this Chart?
Markets are flirting with madness. Valuations are screaming “bubble.” History says this level doesn’t come around often. The question is—does it pop, or keep flying?
MoneyShow Chart of the Day 10/29/2025: Yes, this Bull IS Still Young!
Wall Street’s worries are loud, but the data says the bull still has room to run.

 Advantages of ETFs over Mutual Funds1/6
Lower Costs
In this guide, we'll explore the advantages of ETFs over mutual funds, giving you valuable insights into why ETFs have gained significant popularity among investors like yourself.
Leveraged ETFs: Unlocking the Potential for Amplified Returns1/6
Understanding Leveraged ETFs
Explore leveraged ETFs: potential for amplified returns & risks. 5 ETFs to consider across equities, commodities & fixed income.
What is a Leveraged ETF?1/6
Introducing Leveraged and Inverse ETFs
In this guide, we'll dive into the world of leveraged ETFs, exploring their definition, mechanics, potential risks, and rewards.
Recent educational content

Asset TV
The ETF Show - New Autism-Impact ETF Launched
Defiance ETFs has launched the first ETF, $ASD, focused on the autism ecosystem, investing in companies that provide services, products, and research related to autism and neurodivergence.


ETF Trends
ETF Industry KPIs June 1, 2026
The ETF Industry saw 22 New Launches, 1 Ticker Change and 1 closure last week.
ETF Trends
ETF Industry KPIs May 20, 2026
The ETF Industry saw 44 New Launches, 3 Mutual Fund Conversions and 9 closures last week.

Asset TV
The ETF Show - Politics Becomes Investable Trade through ETFs
Dan Weiskopf, Senior Portfolio Manager at Tidal Financial Group spoke with the ETF Show about Subversive ETFs that help investors trade like politicians.
Browse all educational columns

Expert-Built ETF Portfolios, All in One Place
Don’t start from scratch. Discover ready-made ETF portfolios built by professionals to match different goals, timelines, and market views. Use them as inspiration or as a starting point for your own allocation.
