Open Now: The Global ETF Survey Take the Survey →



MoneyShow Chart of the Day 3/9/2026: Tallying Up the Costs in Oil Markets
Oil’s biggest surge since 1983. Now the economic bill is coming due


Keep up with what matters in ETFs
Get timely ETF insights, market trends, and top ideas straight to your inbox.
Your newsletter subscriptions with us are subject to ETF Central's Privacy Policy and Terms and Conditions.
Just how much will surging crude oil prices cost investors – and the global economy?
Let’s try to tally up the costs so far...and explore what might happen next.
The ETF Industry Is Evolving Fast
From AI infrastructure to active strategies, the ETF landscape is shifting. Share your perspective in the 7th Annual Global ETF Survey and get exclusive early access to the final report.
Last week alone, US crude oil futures prices shot up 36%. That was the biggest rise in any week since the benchmark contract began changing hands in 1983. Then Sunday night and this morning, WTI futures soared ANOTHER 13%-plus to $102.44 before throttling back a bit. Crude hasn’t traded in the triple digits since 2022, so this is a big move.
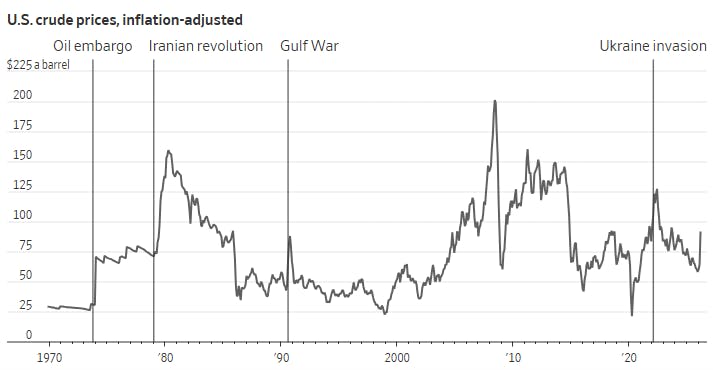
Now let’s look at oil from a historical standpoint. This MoneyShow Chart of the Day (from the Wall Street Journal) shows inflation-adjusted prices going back to 1970.
It only includes trading activity through last Friday, so it doesn’t capture the additional increase we’ve seen in the last 24 hours. But it DOES make clear that prices remain well below past peaks...so far.
Putting Rising Oil in Context: Prices from 1970-Present Day
Source: Wall Street Journal
Will things stay that way? Or are they going to get worse? It all depends on how long the effective blockade of shipping traffic through the Strait of Hormuz lasts.
It’s a HUGE chokepoint for crude oil, liquefied natural gas, and other cargoes – and right now, hardly anything is making it through.
Group of Seven nations are discussing the emergency release of petroleum reserves to blunt the bottleneck impacts globally. Plus, US oil and natural gas output has surged in the last several years – helping cushion the increase in energy prices here at home.
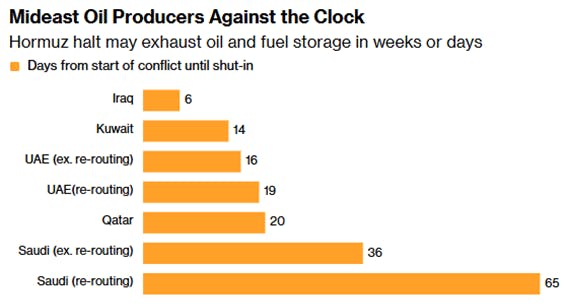
But as this second MoneyShow Chart of the Day (from Bloomberg) shows, Middle East producers are running out of places to put barrels they pull out of the ground. So, one by one, they’re curtailing production. It’ll take time to get things back to “normal” even if the conflict were to end today – suggesting higher prices will linger for some time.
Source: Bloomberg
Bottom line: The costs are high. They’re getting higher. And that could have lasting impacts on markets through the rest of Q1 – and beyond.
If you want to get more articles and chart analysis from MoneyShow, subscribe to our Top Pros’ Top Picks newsletter here
Please note: This is syndicated content and reflects the author’s personal views. It does not represent the opinions of this publication or its affiliates. The article is for informational purposes only and does not constitute investment advice. Always consult a registered financial professional before making any investment decisions.
Mentioned ETFs
Further reading

Latest ETF News
See all ETF newsMoneyShow Chart of the Day 7/16/26: Good News/Bad News on Inflation (and the Fed)
MoneyShow Chart of the Day 7/1/26: The H1 Scorecard – and What Comes Next

MoneyShow Chart of the Day 6/22/26: Are World Cup Videos Helping US Companies Clean Up?

MoneyShow Chart of the Day 6/3/26: AI. AI. AI. (And a Handful of Other Stocks, Too)




 Advantages of ETFs over Mutual Funds1/6
Lower Costs
In this guide, we'll explore the advantages of ETFs over mutual funds, giving you valuable insights into why ETFs have gained significant popularity among investors like yourself.
Leveraged ETFs: Unlocking the Potential for Amplified Returns1/6
Understanding Leveraged ETFs
Explore leveraged ETFs: potential for amplified returns & risks. 5 ETFs to consider across equities, commodities & fixed income.
What is a Leveraged ETF?1/6
Introducing Leveraged and Inverse ETFs
In this guide, we'll dive into the world of leveraged ETFs, exploring their definition, mechanics, potential risks, and rewards.
Recent educational content

ETF Trends
ETF Industry KPIs July 20, 2026
This week’s KPI data overview highlights key metrics and trends shaping the ETF landscape.

ETF Trends
ETF Industry KPIs July 13, 2026
This week’s KPI data overview highlights key metrics and trends shaping the ETF landscape.

First Look ETF
First Look ETF: Cash Deployment, Bond, and Hedged ETFs
In this season 6 episode of First Look ETF, Stephanie Stanton examines the latest ETF marketplace trends with NYSE and guests.

ETF Trends
ETF Industry KPIs July 6, 2026
This week’s KPI data overview highlights key metrics and trends shaping the ETF landscape.
Browse all educational columns



The ETF Industry Is Evolving Fast
From AI infrastructure to active strategies, the ETF landscape is shifting. Share your perspective in the 7th Annual Global ETF Survey and get exclusive early access to the final report.