Global ETF Survey Is Live! 600+ ETF Professionals Weigh In. See Results →



MoneyShow Chart of the Day 10/29/2025: Yes, this Bull IS Still Young!
Wall Street’s worries are loud, but the data says the bull still has room to run.


Keep up with what matters in ETFs
Get timely ETF insights, market trends, and top ideas straight to your inbox.
Your newsletter subscriptions with us are subject to ETF Central's Privacy Policy and Terms and Conditions.
Runaway gains in big tech names. Circular spending deals that create bubble concerns. Big layoff announcements and sliding confidence readings. There are plenty of things to WORRY about as an investor. But here’s one reason NOT to: The bull market is still young!
Yes, you read that right. Young.
Like what you're reading?
Stay in the loop — get the latest ETF insights: trends, analysis, and expert picks.
Take a look at the MoneyShow Chart of the Day, which comes courtesy of Strategas. It shows the average S&P 500 Index bull market lasts for 59 months. This one began in October 2022…meaning it’s only 36 months old.
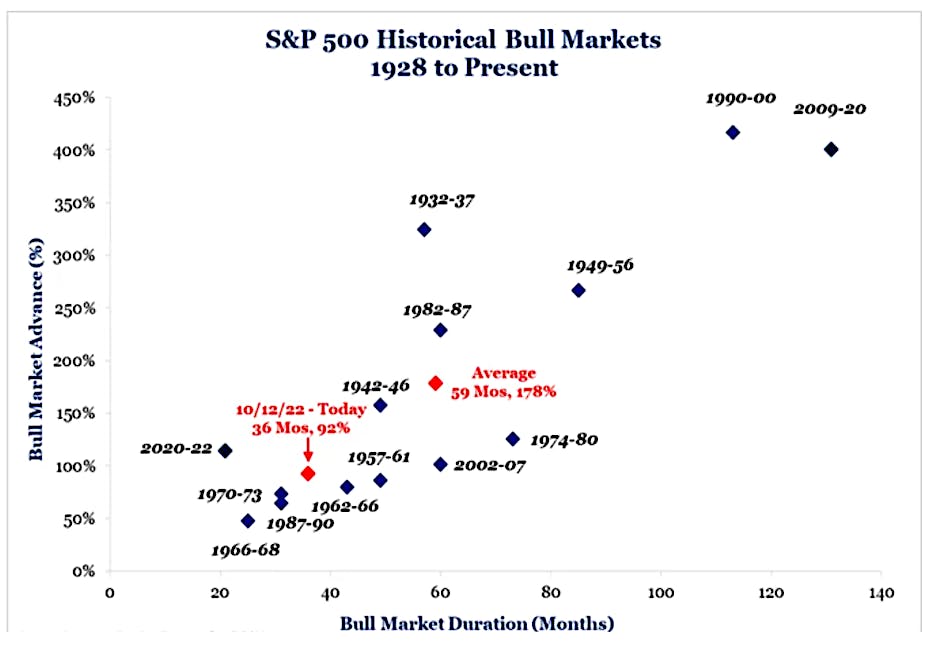
Source: Strategas
Not only that. But we’ve "only" seen gains of 92% so far in this bull market. Sure, that’s a big number. But it’s relatively TAME by comparison to the average post-1928 bull market gain of 178%.
What about the worries I mentioned earlier? They are real. But Wall Street isn’t Main Street, as any experienced trader knows. If CORPORATE profits hold up – or even grow – because of cost-cutting moves like layoffs, stock prices can advance.
Investor sentiment isn’t off-the-charts giddy, either…even with the S&P trading to fresh highs. Plus, we’re entering one of the seasonally strongest periods of the year for stocks, historically speaking.
That doesn’t GUARANTEE markets will rally. After all, weak seasonality in August and September certainly didn’t hold the S&P back this year. But it is another potential tailwind through the rest of 2025.
Bottom line? We do have reasons to worry. But the age of the bull market isn’t one of ‘em.
If you want to get more articles and chart analysis from MoneyShow, subscribe to our Top Pros’ Top Picks newsletter here
Please note: This is syndicated content and reflects the author’s personal views. It does not represent the opinions of this publication or its affiliates. The article is for informational purposes only and does not constitute investment advice. Always consult a registered financial professional before making any investment decisions.
Mentioned ETFs
Further reading
Latest ETF News
See all ETF news
Beyond TLT: Treasury ETFs For the Long Duration Trade


MoneyShow Chart of the Day 9/30/26: Are Hyperscalers the New "Sovereigns?"

Which Fixed-Income ETFs Benefit from Rising Interest Rates?




 Advantages of ETFs over Mutual Funds1/6
Lower Costs
In this guide, we'll explore the advantages of ETFs over mutual funds, giving you valuable insights into why ETFs have gained significant popularity among investors like yourself.
Leveraged ETFs: Unlocking the Potential for Amplified Returns1/6
Understanding Leveraged ETFs
Explore leveraged ETFs: potential for amplified returns & risks. 5 ETFs to consider across equities, commodities & fixed income.
What is a Leveraged ETF?1/6
Introducing Leveraged and Inverse ETFs
In this guide, we'll dive into the world of leveraged ETFs, exploring their definition, mechanics, potential risks, and rewards.
Recent educational content

First Look ETF
First Look ETF: Income, International, and Cash Flow ETFs
In this season 6 episode of First Look ETF, Stephanie Stanton @etfguide examines the latest ETF marketplace trends with NYSE and guests.


ETF Trends
ETF Industry KPIs October 5, 2026
This week’s KPI data overview highlights key metrics and trends shaping the ETF landscape.

ETF Trends
ETF Industry KPIs September 28, 2026
This week’s KPI data overview highlights key metrics and trends shaping the ETF landscape.
ETF Trends
ETF Industry KPIs September 22, 2026
This week’s KPI data overview highlights key metrics and trends shaping the ETF landscape.