Open Now: The Global ETF Survey Take the Survey →



MoneyShow Chart of the Day 11/06/2025: How Worried Should You REALLY be About this Chart?
Markets are flirting with madness. Valuations are screaming “bubble.” History says this level doesn’t come around often. The question is—does it pop, or keep flying?


Keep up with what matters in ETFs
Get timely ETF insights, market trends, and top ideas straight to your inbox.
Your newsletter subscriptions with us are subject to ETF Central's Privacy Policy and Terms and Conditions.
Nosebleed territory. The highest since the Dot-Com Bubble.
Something only seen once in 100-plus years of history. That’s what people are saying about the number on this week’s MoneyShow Chart of the Day. But how worried should you REALLY be?
Like what you're reading?
Stay in the loop — get the latest ETF insights: trends, analysis, and expert picks.
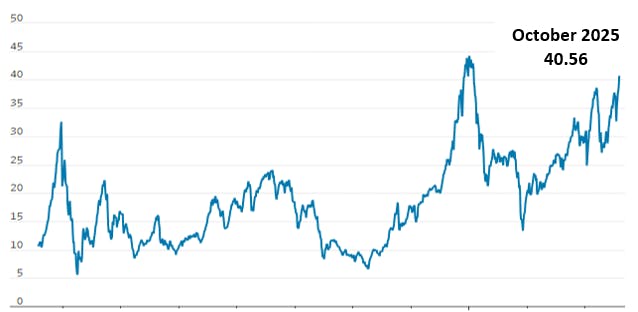
Take a look at the chart and you might think…a lot. It shows the “Cyclically Adjusted Price-to-Earnings” ratio from Nobel Prize winning economist Robert Shiller. Unlike other P/E ratios quoted in the financial press all the time, it includes built-in business cycle-related adjustments. Some experts prefer it as a result.
CAPE Ratio (100-Year Chart)
Source: Wall Street Journal
The reading climbed to 40.5 in October. Not only is that up from 37.3 a year earlier, but it’s very close to the all-time high of 44.1 in December 1999. Yes, that was just before the Dot-Com Bubble popped.
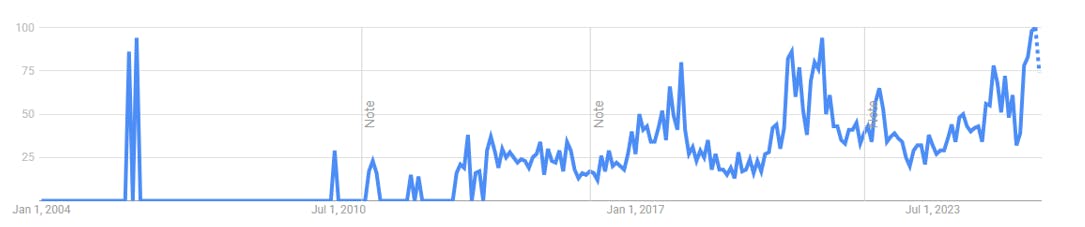
Google Trends shows the search term “Overvalued Market” is EXTREMELY popular right now in the US, too. In fact, it was the most popular on record in October as you can see in this bonus chart (the data goes back to 2004).
Interest Over Time for "Overvalued Market" Search Term
Source: Google Trends
But it’s worth pointing out that valuation readings are lousy indicators when it comes to trading. Overvalued markets – and overvalued stocks – can get MORE overvalued for a long time.
Just look at the chart. That same search term was also very popular in January 2018, June 2020, and February 2021...and relatively popular at several other points in the last 15 years. If you sold the SPDR S&P 500 ETF
If you’re worried about overvaluation and exuberance in the AI space, guess what? You can invest elsewhere! There are plenty of sectors and stocks to choose from.
And if you’re an aggressive momentum-based trader, you may want to just keep buying pullbacks and keep stops tight. At least until “overvaluation” goes from being something to talk about over a cocktail to a bull-killing catalyst.
If you want to get more articles and chart analysis from MoneyShow, subscribe to our Top Pros’ Top Picks newsletter here
Please note: This is syndicated content and reflects the author’s personal views. It does not represent the opinions of this publication or its affiliates. The article is for informational purposes only and does not constitute investment advice. Always consult a registered financial professional before making any investment decisions.
Mentioned ETFs
Further reading

Latest ETF News
See all ETF newsMoneyShow Chart of the Day 7/16/26: Good News/Bad News on Inflation (and the Fed)

MoneyShow Chart of the Day 7/1/26: The H1 Scorecard – and What Comes Next

MoneyShow Chart of the Day 6/22/26: Are World Cup Videos Helping US Companies Clean Up?

MoneyShow Chart of the Day 6/3/26: AI. AI. AI. (And a Handful of Other Stocks, Too)




 Advantages of ETFs over Mutual Funds1/6
Lower Costs
In this guide, we'll explore the advantages of ETFs over mutual funds, giving you valuable insights into why ETFs have gained significant popularity among investors like yourself.
Leveraged ETFs: Unlocking the Potential for Amplified Returns1/6
Understanding Leveraged ETFs
Explore leveraged ETFs: potential for amplified returns & risks. 5 ETFs to consider across equities, commodities & fixed income.
What is a Leveraged ETF?1/6
Introducing Leveraged and Inverse ETFs
In this guide, we'll dive into the world of leveraged ETFs, exploring their definition, mechanics, potential risks, and rewards.
Recent educational content

ETF Trends
ETF Industry KPIs July 20, 2026
This week’s KPI data overview highlights key metrics and trends shaping the ETF landscape.

ETF Trends
ETF Industry KPIs July 13, 2026
This week’s KPI data overview highlights key metrics and trends shaping the ETF landscape.
First Look ETF
First Look ETF: Cash Deployment, Bond, and Hedged ETFs
In this season 6 episode of First Look ETF, Stephanie Stanton examines the latest ETF marketplace trends with NYSE and guests.

ETF Trends
ETF Industry KPIs July 6, 2026
This week’s KPI data overview highlights key metrics and trends shaping the ETF landscape.
Browse all educational columns



Build and Analyze Your ETF Portfolio Like a Pro
Create your own ETF portfolio in minutes and instantly see allocations, exposures, performance, and risk. Visualize diversification across asset classes, regions, and sectors. Stress-test ideas, compare benchmarks, and refine your strategy with professional-grade analytics.
