Explore professionally built ETF model portfolios. Discover now →



MoneyShow Chart of the Day 2/2/2026: The Wildest Week in Metals Ever?
Silver just delivered a historic gut punch. A once-in-a-generation price swing that reminded traders and investors alike how violent precious-metal bull markets can get.


Keep up with what matters in ETFs
Get timely ETF insights, market trends, and top ideas straight to your inbox.
Your newsletter subscriptions with us are subject to ETF Central's Privacy Policy and Terms and Conditions.
Was last week the wildest week in the metals market…ever? It sure looked and felt that way! But what does it mean longer-term if you’re a metals trader or investor?
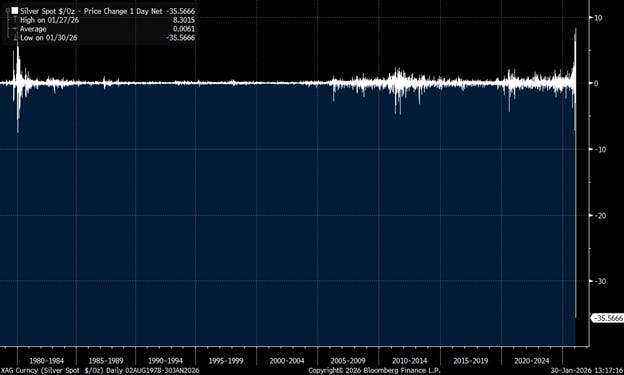
Let’s start with a double-dose of MoneyShow Charts of the Day. The first shows the net 1-day price change in spot silver since the late 1970s.
As you can see, the dollar amount that silver covered last week was unlike anything we’ve ever seen. The junior precious metal plunged from a high of $121.60 on Thursday, Jan. 29 to as low as $74 on Friday, Jan. 30. Wow!
Like what you're reading?
Stay in the loop — get the latest ETF insights: trends, analysis, and expert picks.
Silver Just Swung the Most in History
Source: Bloomberg
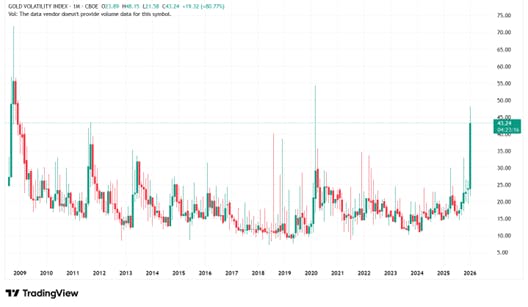
Next, take a look at my second chart – the CBOE Gold Volatility Index (GVZ). It shows expected 30-day volatility of returns on the SPDR Gold Shares (GLD). Or in other words, it’s like the “VIX”...only for gold rather than stocks.
Gold Volatility Soared - But Not QUITE to a Record
Source: TradingView
In this case, the GVZ soared to as high as 48.1 last week from 23.9 the week before. That’s a huge move. But that reading wasn’t quite as high as the 71.9 peak we saw during the Great Financial Crisis or the 54.3 level we saw during the Covid pandemic.
But let’s not split hairs. Wild it was. It put a big exclamation point on these statements I shared last Monday: “We’re going almost parabolic in the short term, which increases the risk of a painful correction out of the blue. Traders should keep that in mind.”
Now here’s the important part: Throughout this bull market in bullion, we’ve had periodic blow off peaks. I wrote about the last one in October here. But none of them proved to be the proverbial “Top” for the whole bull run. They were just waystations on the road to higher prices.
As a TRADER, you can’t get caught up in the momentum when things go parabolic. You have to tighten stops, reduce position sizes, and take other precautionary steps to protect yourself.
As an INVESTOR, you have to remember to take advantage of sharp pullbacks. Let the volatility settle down, wait for metals to find new bases, then start adding on the cheap. One day that approach will stop working – when the final top is in.
But for what it’s worth, I don’t think last week was it!
If you want to get more articles and chart analysis from MoneyShow, subscribe to our Top Pros’ Top Picks newsletter here
Please note: This is syndicated content and reflects the author’s personal views. It does not represent the opinions of this publication or its affiliates. The article is for informational purposes only and does not constitute investment advice. Always consult a registered financial professional before making any investment decisions.
Mentioned ETFs
Further reading

Latest ETF News
See all ETF newsMoneyShow Chart of the Day 9/4/26: Don't Just Watch Oil. Watch THESE.

Chart of the Day 8/14/26: The Great "Hot Money" Migration

MoneyShow Chart of the Day 7/29/26: Now, THAT's What I Call Market Rotation!

MoneyShow Chart of the Day 7/16/26: Good News/Bad News on Inflation (and the Fed)




 Advantages of ETFs over Mutual Funds1/6
Lower Costs
In this guide, we'll explore the advantages of ETFs over mutual funds, giving you valuable insights into why ETFs have gained significant popularity among investors like yourself.
Leveraged ETFs: Unlocking the Potential for Amplified Returns1/6
Understanding Leveraged ETFs
Explore leveraged ETFs: potential for amplified returns & risks. 5 ETFs to consider across equities, commodities & fixed income.
What is a Leveraged ETF?1/6
Introducing Leveraged and Inverse ETFs
In this guide, we'll dive into the world of leveraged ETFs, exploring their definition, mechanics, potential risks, and rewards.
Recent educational content

ETF Trends
ETF Industry KPIs September 8, 2026
This week’s KPI data overview highlights key metrics and trends shaping the ETF landscape.

ETF Trends
ETF Industry KPIs August 31, 2026
This week’s KPI data overview highlights key metrics and trends shaping the ETF landscape.
ETF Trends
ETF Industry KPIs August 24, 2026
This week’s KPI data overview highlights key metrics and trends shaping the ETF landscape.
What’sTheFund
What's the Fund | Ocean Park Diversified Income ETF (DUKZ)
James St Aubin, Chief Investment Officer at Ocean Park Asset Management, discuss the DUKZ ETF, exposing investors to the whole spectrum of asset classes in the fixed income markets, through their rules-based process.

Browse all educational columns



Build and Analyze Your ETF Portfolio Like a Pro
Create your own ETF portfolio in minutes and instantly see allocations, exposures, performance, and risk. Visualize diversification across asset classes, regions, and sectors. Stress-test ideas, compare benchmarks, and refine your strategy with professional-grade analytics.
