Keep tabs on your favorite ETFs with a personalized weekly tracker. Create a Watchlist now →
BROUGHT TO YOU BY:



1W flows +$16.45B
1W flows +$1.24B
1W flows +$1.11B
1W flows +$7.43B
1W flows +$1.76B
1W flows -$687M
1W flows +$1.26B
1W flows -$179M
1W flows +$5.43B
1W flows +$4.89B
1W flows +$99M
1W flows -$1.55B
1W flows +$383M
1W flows -$528M
1W flows -$29M
1W flows -$827M
Last update: Today 5:29 PM
1W flows +$16.45B
1W flows +$1.24B
1W flows +$1.11B
1W flows +$7.43B
1W flows +$1.76B
1W flows -$687M
1W flows +$1.26B
1W flows -$179M
1W flows +$5.43B
1W flows +$4.89B
1W flows +$99M
1W flows -$1.55B
1W flows +$383M
1W flows -$528M
1W flows -$29M
1W flows -$827M
ETFs, Data & Tools
Latest ETF News
See all ETF news
Some ETFs are using special purpose vehicles (SPVs) to give investors economic exposure to private companies such as Polymarket and Anduril alongside publicly traded stocks.

ETF Model Portfolios: The Anti-Inflation and Rising Interest Rate Allocation
This four-ETF model portfolio targets asset classes that may be better positioned for a combination of persistent inflation and rising interest rates.

Trending on ETF Central
Content from our partners
Model portfolios
Four-Pillar Portfolio
The Four Pillar Strategy is a passive investment model designed to capture global market returns efficiently and at minimal cost. By focusing on four distinct, non-correlated asset classes, this portfolio provides a framework for long-term capital appreciation and inflation protection. The strategy rests on four pillars: Total US Equities, International Stocks, Total Bond Market, and Real Estate Investment Trusts (REITs). The addition of REITs offers an additional layer of diversification.
 by ETF Central
Balanced 60/40 Portfolio
Built on the foundational principles of diversification, this model allocates 60% of capital to equities for long-term growth and 40% to fixed-income securities to provide a defensive cushion and steady income. Investors have utilized the 60/40 investment strategy to navigate diverse market cycles. The equity portion captures the upside of economic expansion and corporate earnings. Conversely, the bond component acts as a stabalizer. This synergy aims to optimize risk-adjusted returns.
by ETF CentralEndowment Model
The Yale Endowment Model, pioneered by David Swensen, moves beyond the traditional 60/40 portfolio by emphasizing a diversification into other asset classes, designed to generate equity-like returns with reduced systemic risk. This model prioritizes broad-market exposure while allocating a significant portion to Real Estate (REITs) and inflation-sensitive assets. The fixed-income component is strategically split between Intermediate Treasuries and Treasury Inflation-Protected Securities (TIPS).
by ETF Central
- Advanced ETF data and analysis
- Advanced screener filters
- Access to ETF Portfolio Builder
- Personal Watchlist
The latest news from The Home of ETFs, delivered straight to your inbox.
Sign up for our weekly newsletter today.
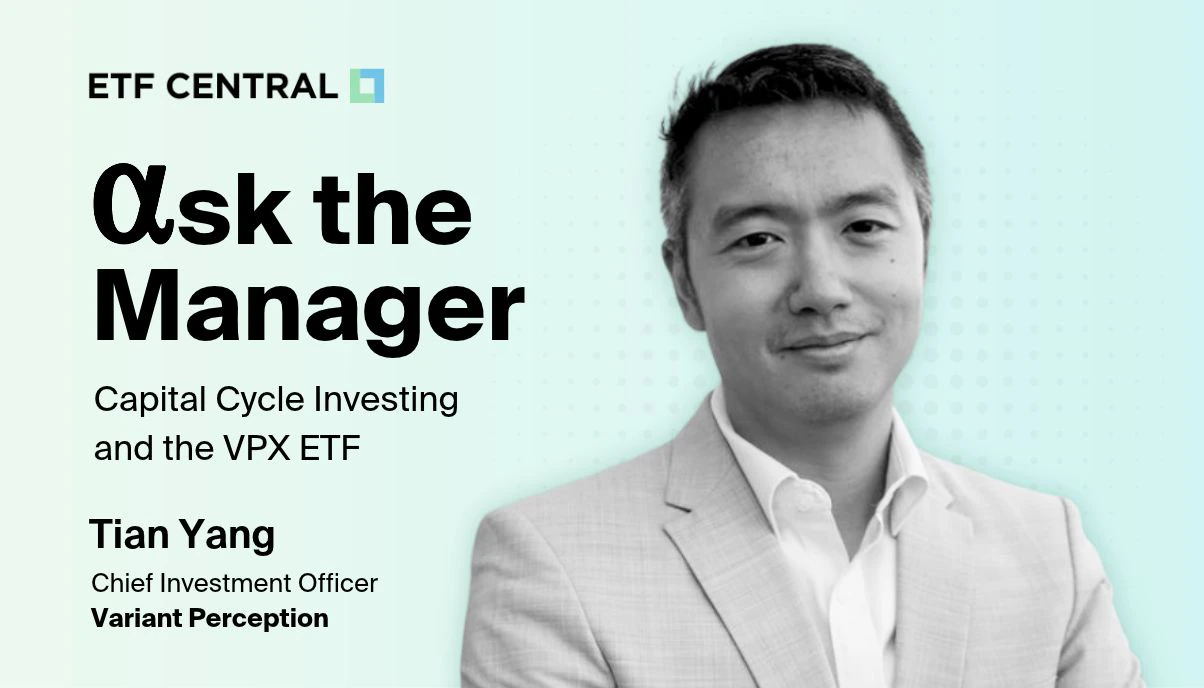
Tian Yang discusses capital cycle investing, index concentration, and the mechanics behind its Cycle Aware US Equity ETF (VPX).

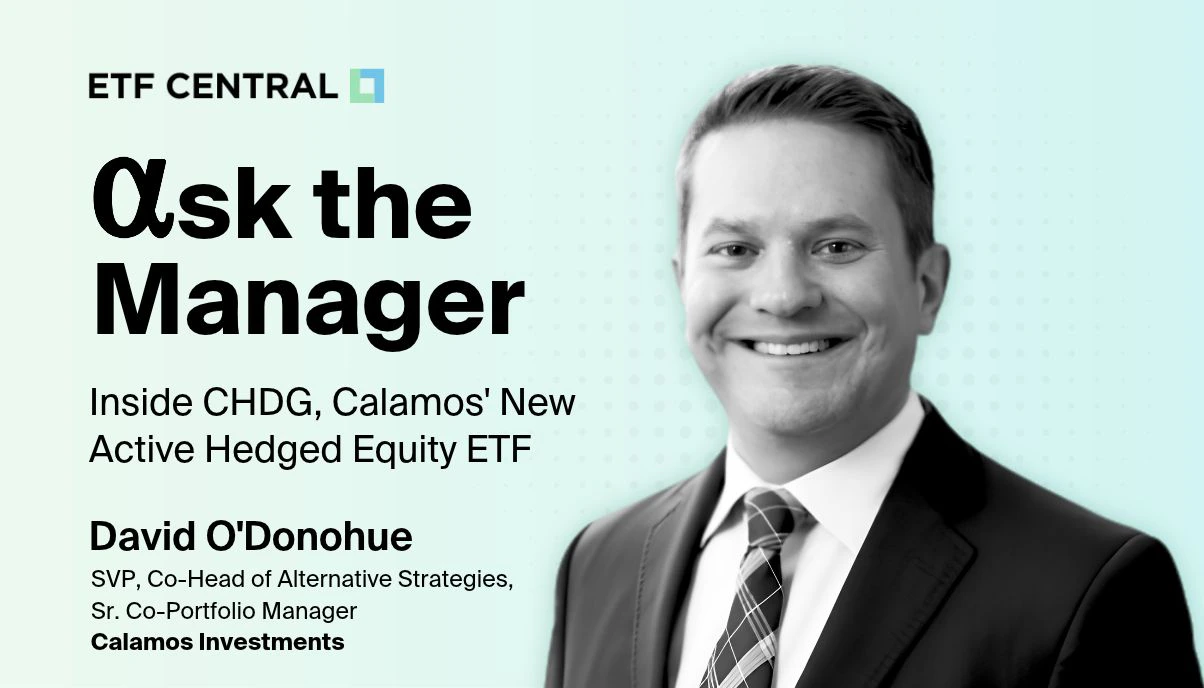
Dave O'Donohue of Calamos Investments discusses how CHDG brings the firm's decades of dynamic hedging experience into an actively managed ETF built for a changing market environment.
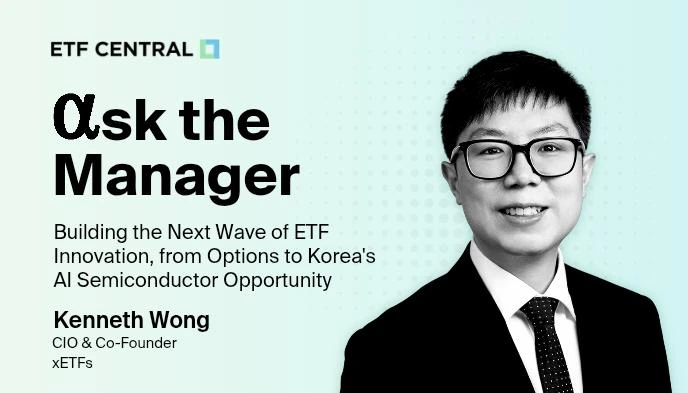
Kenneth Wong, CIO and Co-Founder of xETFs, discusses the firm's approach to ETF innovation and how the xETFs Korea AI Semiconductor ETF (KSMH) targets the broader ecosystem behind the AI-driven memory upcycle.
Some ETFs are using special purpose vehicles (SPVs) to give investors economic exposure to private companies such as Polymarket and Anduril alongside publicly traded stocks.

Frontier market ETFs offer exposure to smaller, less-developed stock markets that typically receive little or no representation in conventional global equity portfolios.

With the 10-year Treasury yield reaching 5%, these bond ETFs offer investors direct exposure to intermediate-term U.S. government debt.
More topics
See all topicsETF Creation Windows Matter More Than You Think
Why the timing of ETF creation and redemption cutoffs can affect execution quality on large orders.

Why the Time of Day Matters When Trading an ETF
An ETF may trade from 9:30 a.m. to 4:00 p.m., but that doesn’t mean every minute of the trading day is created equal.
Trump Accounts: Here's Which ETFs You Can Invest In
Learn which are available within a Trump Account and how to build a low-cost, diversified investment portfolio within the program's rules.

The ETF Underdogs, Part 9: Wide Moats and Competitive Advantages
New ETF issuers are bringing active approaches to the timeless concept of economic moats, offering investors another way to target businesses with durable competitive advantages.
ETFs Versus CEFs: What’s the Difference?
For investors, there can be significant disparities in terms of fees, leverage, distributions, and liquidity.


Movers & Shakers
Segments
ETFs
Issuers
| Best performance, 1 week | 1W perf. | YTD perf. |
|---|---|---|
| BioTech & Genomics | +3.34% | +68.50% |
| Cryptocurrency | +1.54% | -1.41% |
| US Info. Technology | +1.53% | +45.91% |
| Energy | +0.91% | +103.49% |
| Healthcare Technology | +0.72% | +5.60% |
| Worst performance, 1 week | 1W perf. | YTD perf. |
|---|---|---|
| Cannabis & Psychedelics | -14.52% | -2.61% |
| Niche Commodity | -8.31% | +66.69% |
| Blockchain | -6.36% | +11.37% |
| Metal ex-Gold | -6.06% | -12.99% |
| Alternative Energy | -4.89% | -4.95% |
| Most inflows, 1 week | 1W flow | YTD flows |
|---|---|---|
| US Large Cap | +$16.45B | +$274.35B |
| Municipal Bonds | +$8.33B | +$58.46B |
| Global Blended Cap | +$7.43B | +$83.74B |
| US Aggregate Bonds | +$5.43B | +$100.19B |
| Money Market Bonds | +$5.13B | +$99.93B |
| Most outflows, 1 week | 1W flow | YTD flows |
|---|---|---|
| US Info. Technology | -$3.27B | +$29.08B |
| Multiple Trends | -$2.09B | +$2.30B |
| MBS & ABS | -$1.65B | +$7.72B |
| US Corporate HY Bonds | -$1.55B | +$3.00B |
| US Real Estate | -$1.05B | +$2.92B |
Data period: September 24 - October 1, 2026
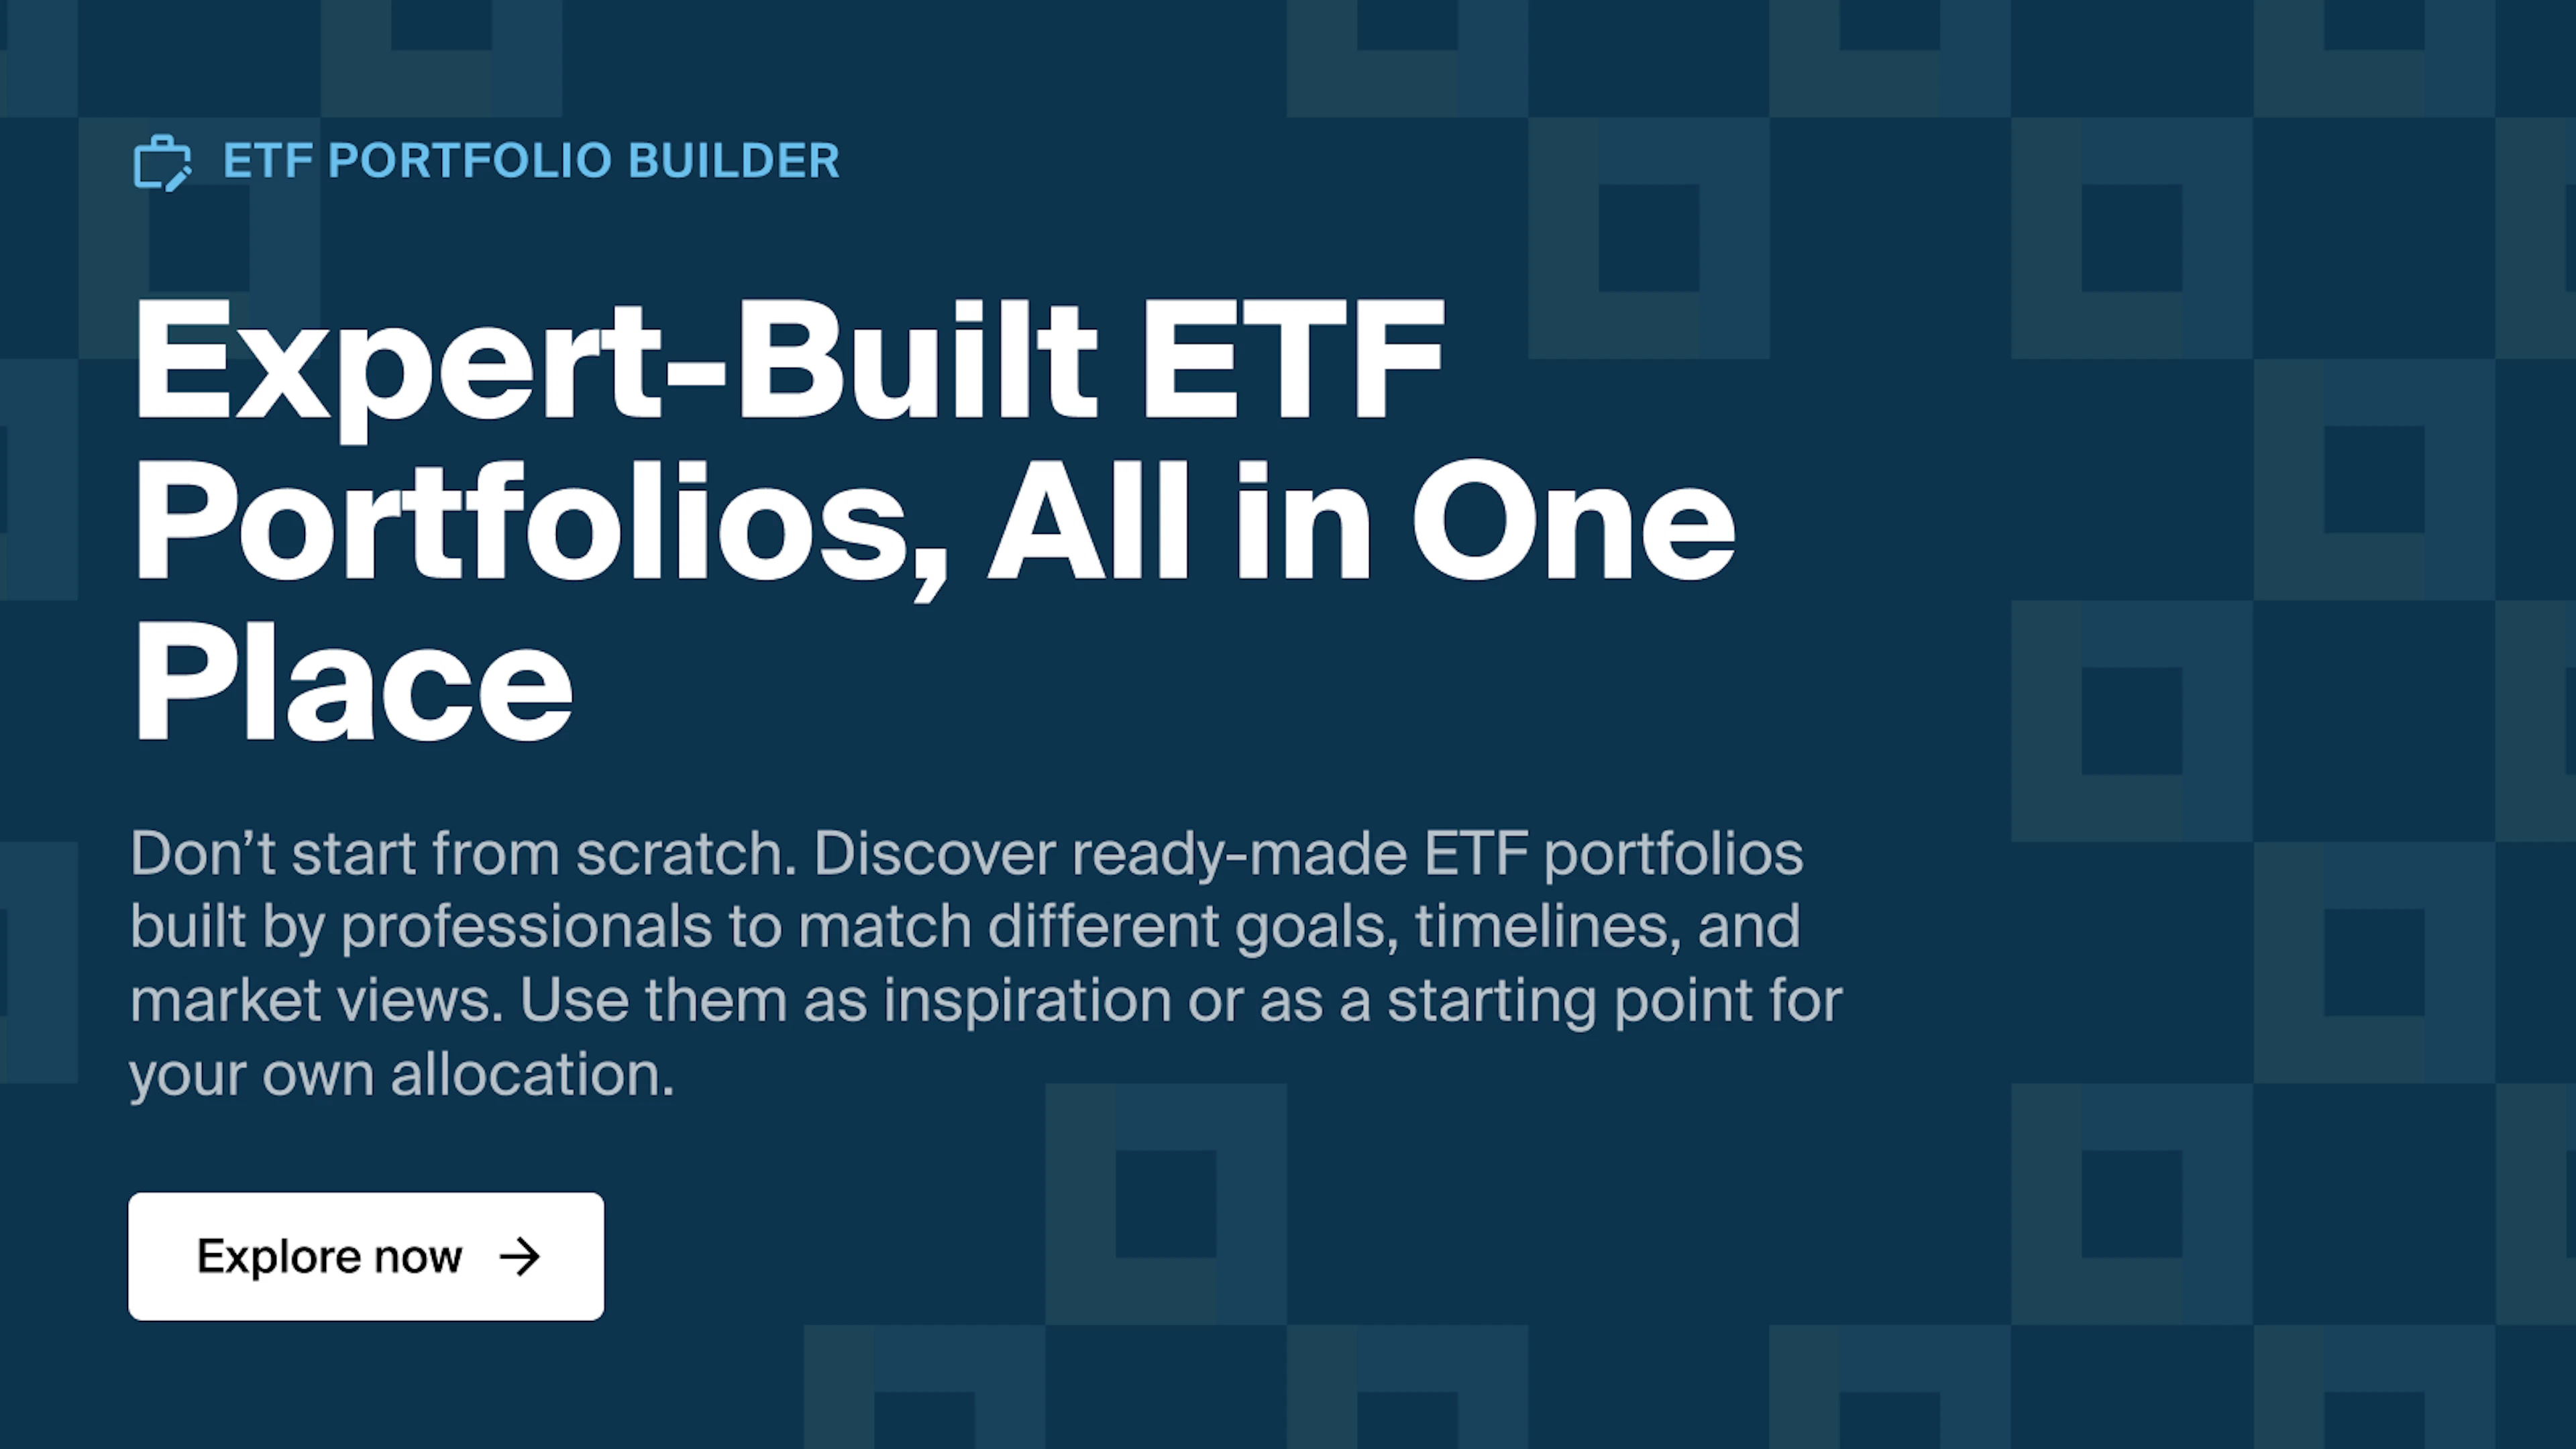
Expert-Built ETF Portfolios, All in One Place
Don’t start from scratch. Discover ready-made ETF portfolios built by professionals to match different goals, timelines, and market views. Use them as inspiration or as a starting point for your own allocation.