Explore professionally built ETF model portfolios. Discover now →

Top 3 value ETFs of 2022
These ETFs provide access to value stocks via different strategies.


Keep up with what matters in ETFs
Get timely ETF insights, market trends, and top ideas straight to your inbox.
Your newsletter subscriptions with us are subject to ETF Central's Privacy Policy and Terms and Conditions.
After being "dead" for more than a decade, the value risk premium might finally be mounting a comeback. With interest rates and inflation running high, growth stocks have finally faltered after a multi-year bull run, tanking hard in 2022. In contrast, value stocks have held up fairly well.
According to Eugene Fama and Kenneth French's Five-Factor model, the "value" risk factor refers to the historically excess returns of stocks with higher book-to-market ratios, stylized as "High minus Low (HmL). These stocks generally trade at more favorable valuations and have greater risk, and thus have potentially higher upside potential.
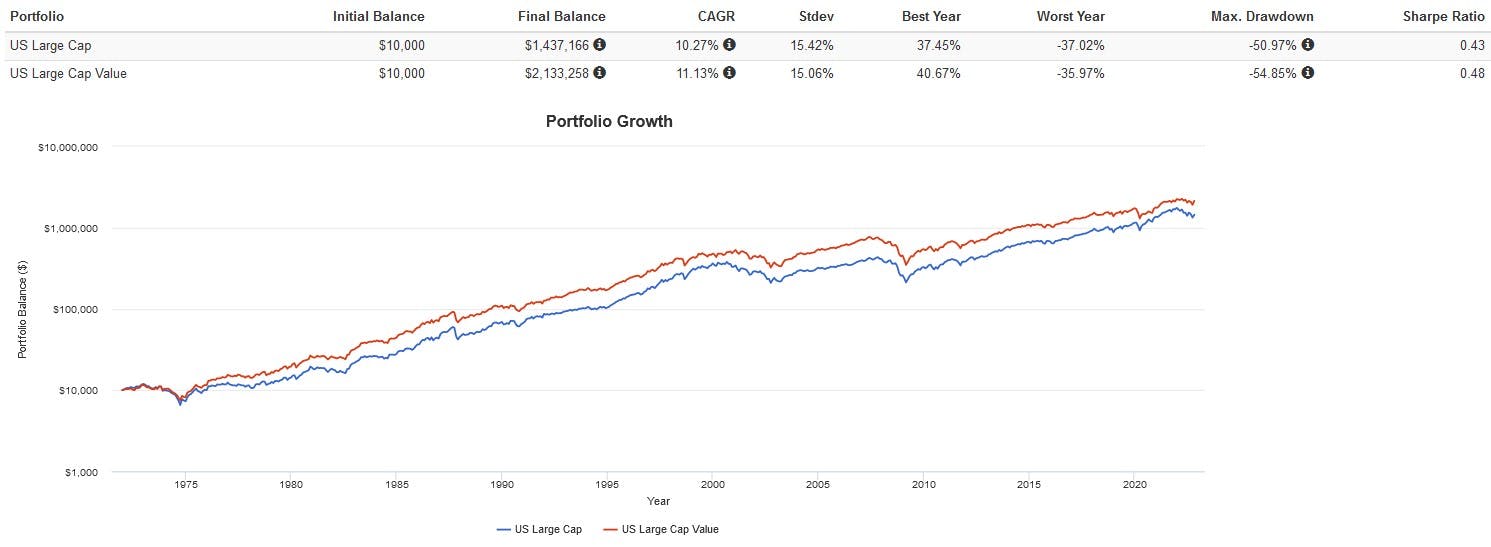
Historically, U.S. value stocks have outperformed the broader market since 1971, on both a trailing and rolling return basis:

That being said, there have been years where the value risk premium returned negative. These were periods of time when growth stocks beat their value counterparts. This is to be expected. Even the market risk premium has returned negative on occasion, as evidenced by periods when bonds beat stocks.
Investors interested in overweighting value stocks, called a value "tilt" can do so via various passive and actively managed value ETFs. Keep in mind that a value tilt can underperform for extended periods of time and incur high tracking error relative to a benchmark. Investors who tilt value must trust its theoretical underpinnings and be willing to stay the course.
Like what you're reading?
Stay in the loop — get the latest ETF insights: trends, analysis, and expert picks.
Vanguard Value ETF (VTV)
A popular low-cost option for passive value investors is the Vanguard Value ETF (VTV), which tracks the CRSP US Large Cap Value Index. With 341 holdings, VTV is fairly diversified and falls into the "large-value" style box category. Most of the ETF is dominated by healthcare, financial, industrial, consumer staple, and energy sector companies. With an expense ratio of just 0.04%, the ETF is one of the cheapest value funds on the market. However, its exposure to value stocks isn't as robust as some of the others, as it seeks to track a benchmark as opposed to actively screening for value metrics.
Invesco Pure Value ETF (RPV)
Value investors looking for a quasi-actively managed ETF can consider RPV. This ETF screens for picks by assigning each stock in the S&P 500 two-style scores. For value, stocks are scored based on their price-to-book, price-to-earnings, and price-to-sales ratios. For growth, stocks are scored based on their three-year sales per share growth, the three-year ratio of earnings per share change to price per share, and momentum by a 12-month percentage change in price. The ratio between the value and growth score for each stock is calculated and rank ordered as deep value, blend, or deep growth. RPV will only select stocks ranked as deep value, with the higher-ranking ones weighted heavier. The ETF costs an expense ratio of 0.35%.
Dimensional US Targeted Value ETF (DFAT)
Dimensional Fund Advisors (DFA) has a longstanding history of active factor investing, particularly when it comes to size and value stocks. In recent years, DFA released many of their longstanding mutual funds, previously only accessible through advisors in ETF form. DFAT targets value stocks by looking for low price-to-book, price-to-cash flow, and price-to-earnings ratios. DFAT also screens picks for robust profitability, which it defines as a company with high earnings or profits from operations in relation to its book value or assets. Finally, DFAT also implements short-term considerations for price momentum and conservative investment. The ETF has an expense ratio of 0.29%.
Factor regression results
I conducted a factor regression of all three funds from July 2021 to the present (limited by DFAT's short history). In terms of loadings for value, RPV and DFAT scored the highest as expected. VTV's value loading was significantly lower. Interestingly, DFAT also had high loadings for size, thanks to its many mid-cap and small-cap stocks. This is another risk factor that has historically driven higher returns.

Please note this article is for information purposes only and does not constitute investment advice.
Latest ETF News
See all ETF newsETF Comparison: Global X Data Center REITs & Digital Infrastructure ETF (DTCR) Versus Pacer Data & Infrastructure Real Estate ETF (SRVR)

Calamos Autocallable Growth ETF (CAGE): The Next Evolution of Structured Products


 Advantages of ETFs over Mutual Funds1/6
Lower Costs
In this guide, we'll explore the advantages of ETFs over mutual funds, giving you valuable insights into why ETFs have gained significant popularity among investors like yourself.
Leveraged ETFs: Unlocking the Potential for Amplified Returns1/6
Understanding Leveraged ETFs
Explore leveraged ETFs: potential for amplified returns & risks. 5 ETFs to consider across equities, commodities & fixed income.
What is a Leveraged ETF?1/6
Introducing Leveraged and Inverse ETFs
In this guide, we'll dive into the world of leveraged ETFs, exploring their definition, mechanics, potential risks, and rewards.
Recent educational content

Asset TV
The ETF Show - Investors Can Fight Healthcare Inflation with Newly Launched ETFs
Adam Schenck, Principal and Managing Director of Fund Services at Milliman joined The ETF Show to discuss Milliman's first ETFs designed to hedge against rising healthcare inflation.


ETF Trends
ETF Industry KPIs April 20, 2026
The ETF Industry saw 14 New Launches, 1 Ticker Change and 16 closures last week.

Asset TV
The ETF Show - Investors Run to Cash Alternatives as Markets Remain Volatile
Jason England, Portfolio Manager and Fixed Income Strategist from Simplify joined The ETF Show to discuss investor allocations to fixed income as markets continue on their rollercoaster ride.
ETF Trends
ETF Industry KPIs March 30, 2026
The ETF Industry saw 33 New Launches, 1 Ticker Change and 9 closures last week.
Browse all educational columns

Have you tried our ETF Compare tool?
Compare ETFs like a pro. Analyze fees, performance, exposure & holdings side-by-side.