Explore professionally built ETF model portfolios. Discover now →



Tony's ETF Buyers Guide: Aerospace & Defense ETFs
Looking to overweight aerospace and defense stocks? Read this guide before you buy.


Keep up with what matters in ETFs
Get timely ETF insights, market trends, and top ideas straight to your inbox.
Your newsletter subscriptions with us are subject to ETF Central's Privacy Policy and Terms and Conditions.
The aerospace and defense sector has increasingly become a focal point for investors amidst ongoing geopolitical tensions and conflicts.
Beginning with the Russian invasion of Ukraine in February 2022, escalating with the Israel-Hamas conflict in October 2023, and now with the ongoing actions of Yemen's Houthi movement against commercial vessels, these events have continually underscored the relevance of aerospace and defense stocks.
For those seeking a deeper understanding of how these geopolitical events impact defense stocks, my previous article offers an in-depth analysis, featuring valuable insights from Tony Bancroft, the Portfolio Manager for the Gabelli Commercial Aerospace & Defense ETF (GCAD).
Now, if you're considering investing in an aerospace and defense ETF, it's crucial to approach this decision with care. While the sector-specific ETF space dedicated to aerospace and defense is relatively small, the available options vary in subtle but significant ways.
In today's ETF buyer's guide, I will walk you through the different aerospace and defense ETFs available, highlighting their unique features, performance metrics, and how they might fit into your broader investment strategy.
Like what you're reading?
Stay in the loop — get the latest ETF insights: trends, analysis, and expert picks.
The Big Three: Overview
In the realm of aerospace & defense ETFs, three major funds stand out based on their assets under management (AUM): the iShares U.S. Aerospace & Defense ETF (ITA), the Invesco Aerospace & Defense ETF (PPA), and the SPDR S&P Aerospace & Defense ETF (XAR).
Each of these ETFs offers a different approach to investing in the sector, and as of January 3rd, 2024, their basic metrics provide a snapshot of their characteristics and performance.
The Big Three: Analysis
ITA is currently the most popular and liquid option in this space, characterized by a tight 0.02% bid-ask spread and a decent 30-day average volume of around 360,000 shares. ITA also boasts a robust options chain, making it particularly appealing for traders.
However, buy-and-hold investors should be aware of its concentration risk. As of January 3rd, nearly 20% of ITA's holdings are in Boeing, its top holding, with Raytheon Technologies (RTX) and Lockheed Martin (LMT) making up significant portions as well.
This concentration is a natural result of ITA's market-cap weighted approach, which tends to favor the larger aerospace and defense contractors.
On the other hand, XAR takes a different approach with its modified equal-weighted index. This method results in a more diversified portfolio, with a higher proportion of mid and small-cap aerospace stocks.
XAR's structure offers less emphasis on the largest contractors, making it suitable for investors seeking growth and potential volatility from smaller companies. However, for those looking for exposure to major firms with large, long-term government contracts, XAR may not be the ideal choice.
Finally, we have PPA, which to me stands out for its more uniform balance. PPA's index, provided by SPADE, a well-regarded resource in defense investing, currently allocates roughly 6-7% each to its top holdings, including Raytheon Technologies, Lockheed Martin, Northrop Grumman, and Boeing.
This balanced approach makes PPA a compelling option for those seeking a more even distribution across large defense companies. Moreover, investors can access a wealth of free resources on SPADE's website, adding value to the PPA investment experience.
The drawback of PPA is its expense ratio, which at 0.58% is significantly higher than both ITA and XAR. However, PPA's historical performance justifies this higher cost to some extent. It has consistently been the top performer in terms of both trailing and rolling returns.
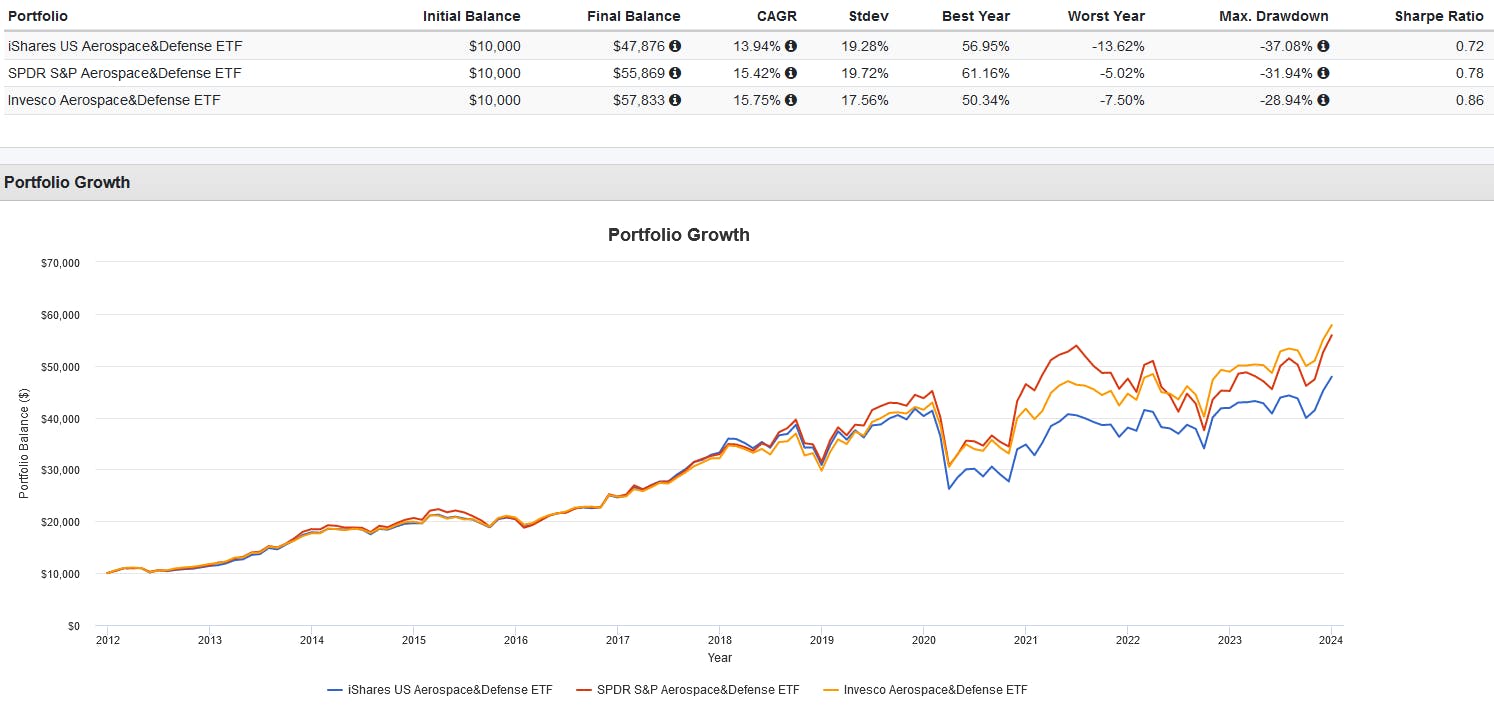

Conclusion: Which Is Best?
My answer to this question is "it depends." It's a bit of a cop-out, but the reality is that the optimal pick truly depends on individual investment goals and strategies. Here's a tailored approach to selecting among ITA, PPA, and XAR:
- Short-Term Trading and Options Exposure: If your focus is on short-term trading and you want access to a robust options market, ITA is the go-to choice. Its high liquidity, evidenced by a tight bid-ask spread and substantial trading volume, makes it well-suited for traders seeking agility and the ability to execute strategies involving options.
- Uniform Exposure to Major Defense Contractors: For investors who prefer a more balanced approach, particularly with an emphasis on large defense contractors, PPA stands out. Its index offers a more evenly distributed weight across leading companies in the sector, providing a comprehensive view of the industry's big players.
- Mid and Small-Cap Growth Potential: If you're aiming for exposure to potentially higher-growth mid and small-cap companies in the aerospace and defense sector, XAR's equal-weighted approach is your best bet.
- Lowest Fees: For cost-conscious investors, both XAR and ITA present competitive options with their lower expense ratios of 0.35% and 0.40%, respectively.
Please note this article is for information purposes only and does not in any way constitute investment advice. It is essential that you seek advice from a registered financial professional prior to making any investment decision.

Latest ETF News
See all ETF newsThere’s an ETF for That? Investing Like University Endowments

Could Water ETFs Be the Next AI Bottleneck Trade?

What is a Boomer Candy ETF?

ETF Comparison: NEOS Nasdaq-100 High Income ETF (QQQI) Versus Goldman Sachs Nasdaq-100 Premium Income ETF (GPIQ)




 Advantages of ETFs over Mutual Funds1/6
Lower Costs
In this guide, we'll explore the advantages of ETFs over mutual funds, giving you valuable insights into why ETFs have gained significant popularity among investors like yourself.
Leveraged ETFs: Unlocking the Potential for Amplified Returns1/6
Understanding Leveraged ETFs
Explore leveraged ETFs: potential for amplified returns & risks. 5 ETFs to consider across equities, commodities & fixed income.
What is a Leveraged ETF?1/6
Introducing Leveraged and Inverse ETFs
In this guide, we'll dive into the world of leveraged ETFs, exploring their definition, mechanics, potential risks, and rewards.
Recent educational content

ETF Trends
ETF Industry KPIs September 14, 2026
This week’s KPI data overview highlights key metrics and trends shaping the ETF landscape.

ETF Trends
ETF Industry KPIs September 8, 2026
This week’s KPI data overview highlights key metrics and trends shaping the ETF landscape.
ETF Trends
ETF Industry KPIs August 31, 2026
This week’s KPI data overview highlights key metrics and trends shaping the ETF landscape.
ETF Trends
ETF Industry KPIs August 24, 2026
This week’s KPI data overview highlights key metrics and trends shaping the ETF landscape.
Browse all educational columns



Build and Analyze Your ETF Portfolio Like a Pro
Create your own ETF portfolio in minutes and instantly see allocations, exposures, performance, and risk. Visualize diversification across asset classes, regions, and sectors. Stress-test ideas, compare benchmarks, and refine your strategy with professional-grade analytics.
