ETF model portfolios designed for real investor needs. Discover →



The Weekly ETF Market Monitor (September 28-October 2, 2026)
A comprehensive snapshot of U.S. ETF market activity in Week 40 (September 28-October 2, 2026), spanning flows, performance, sector and thematic trends, geographic exposures, asset classes, and leading funds and issuers.

Keep up with what matters in ETFs
Get timely ETF insights, market trends, and top ideas straight to your inbox.
Your newsletter subscriptions with us are subject to ETF Central's Privacy Policy and Terms and Conditions.
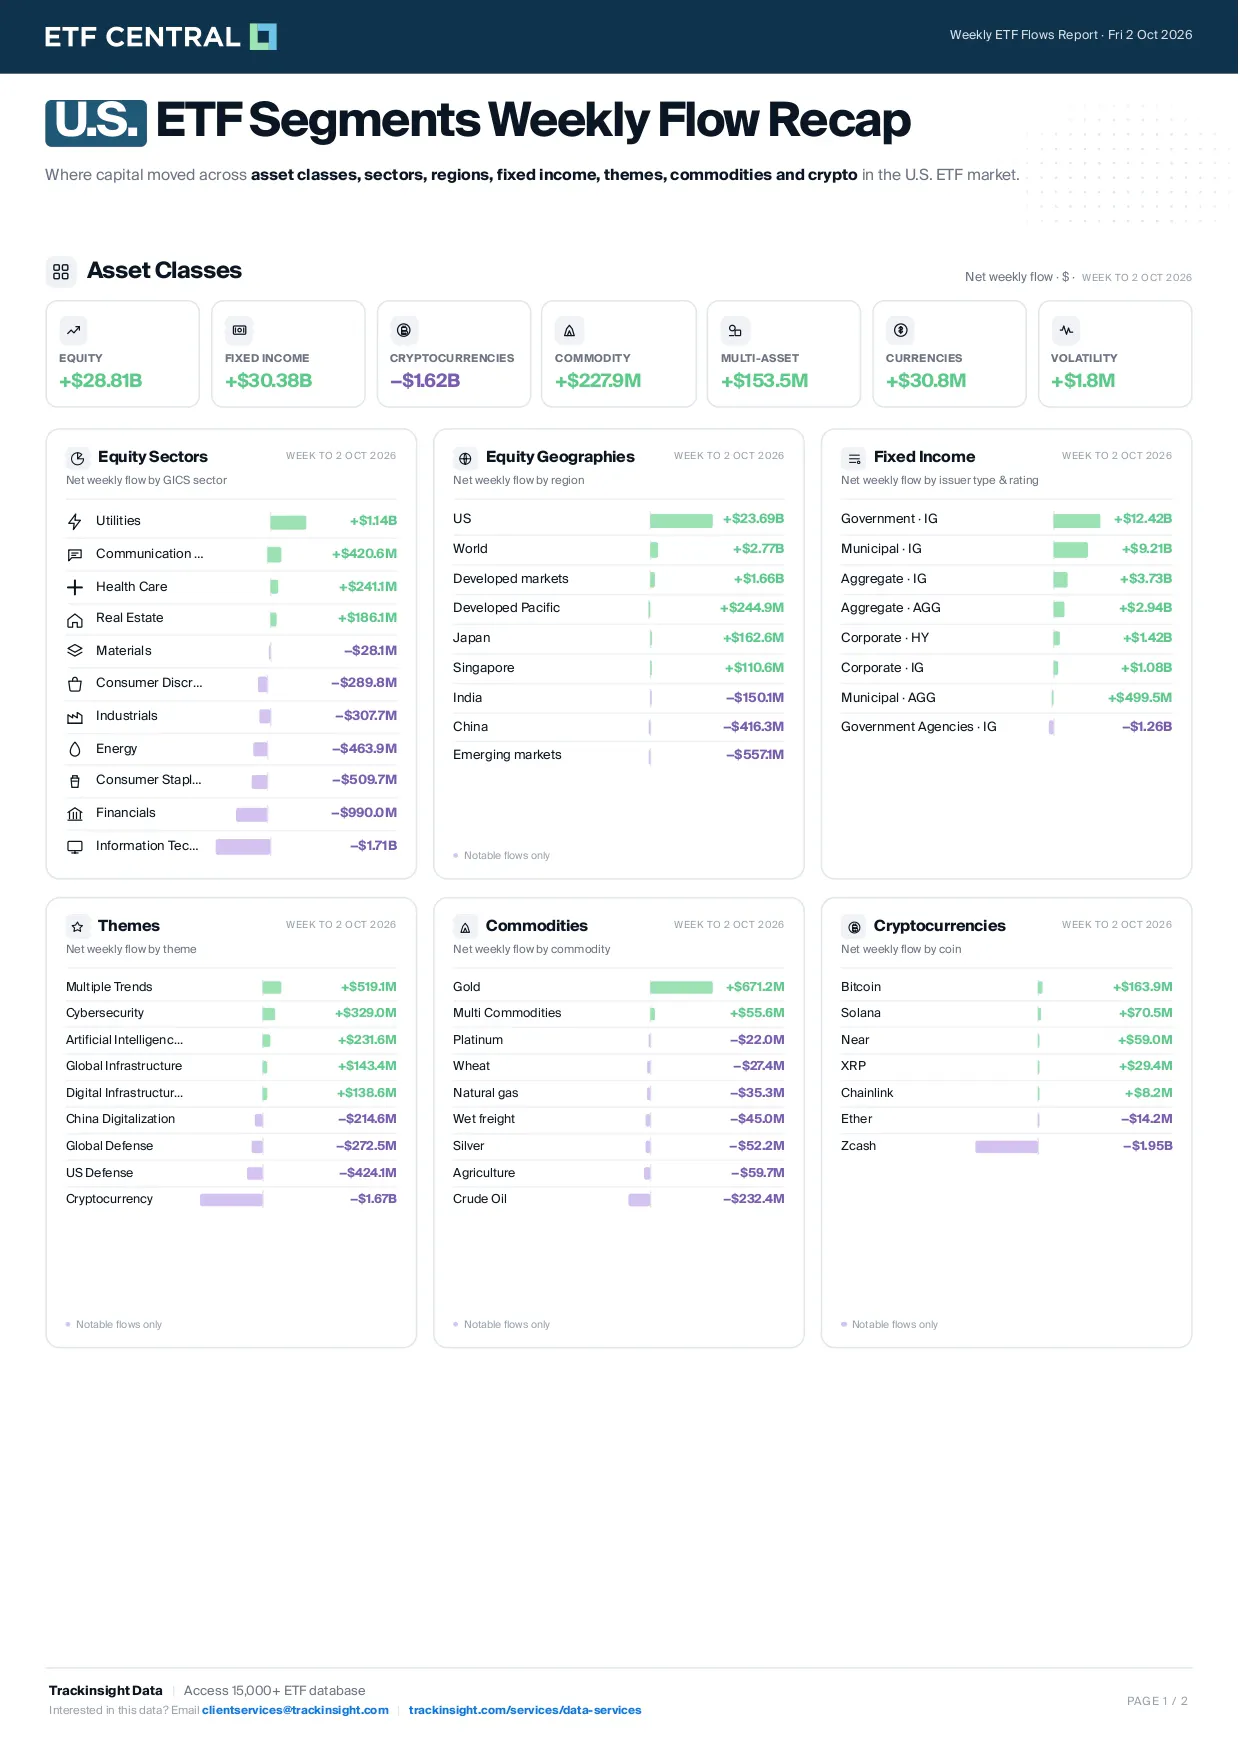
According to data by Trackinsight, U.S.-listed ETFs attracted strong flows during the week ending October 2. Fixed income ETFs gathered $30.38 billion, while equity ETFs attracted $28.81 billion. Commodity products added $227.9 million, while cryptocurrency products recorded $1.62 billion in net outflows.
Utilities led sector ETF inflows with $1.14 billion, followed by Communication Services ($420.6M), Health Care ($241.1M) and Real Estate ($186.1M). Information Technology recorded the largest sector outflow at $1.71 billion, while Financials lost $990.0 million and Consumer Staples saw $509.7 million in outflows.
U.S.-focused equity ETFs dominated geographic flows with $23.69 billion, followed by World ($2.77B) and Developed Markets ($1.66B). Emerging Markets recorded the largest geographic outflow at $557.1 million, while China lost $416.3 million and India saw $150.1 million in outflows.
Multiple Trends topped thematic flows with $519.1 million, followed by Cybersecurity ($329.0M) and Artificial Intelligence & Big Data ($231.6M). Cryptocurrency themes recorded the largest thematic outflow at $1.67 billion, followed by U.S. Defense ($424.1M) and Global Defense ($272.5M).
Government Investment Grade ETFs led fixed income flows with $12.42 billion, followed by Municipal Investment Grade ($9.21B), Aggregate Investment Grade ($3.73B), Corporate High Yield ($1.42B) and Corporate Investment Grade ($1.08B). Government Agencies Investment Grade products recorded $1.26 billion in outflows.
Gold led commodity inflows with $671.2 million, followed by Multi Commodities ($55.6M). Crude Oil recorded the largest commodity outflow at $232.4 million, while Agriculture lost $59.7 million and Silver saw $52.2 million in outflows. Cryptocurrency flows were led by Bitcoin with $163.9 million, followed by Solana ($70.5M), Near ($59.0M) and XRP ($29.4M). Zcash recorded $1.95 billion in outflows, while Ether lost $14.2 million.
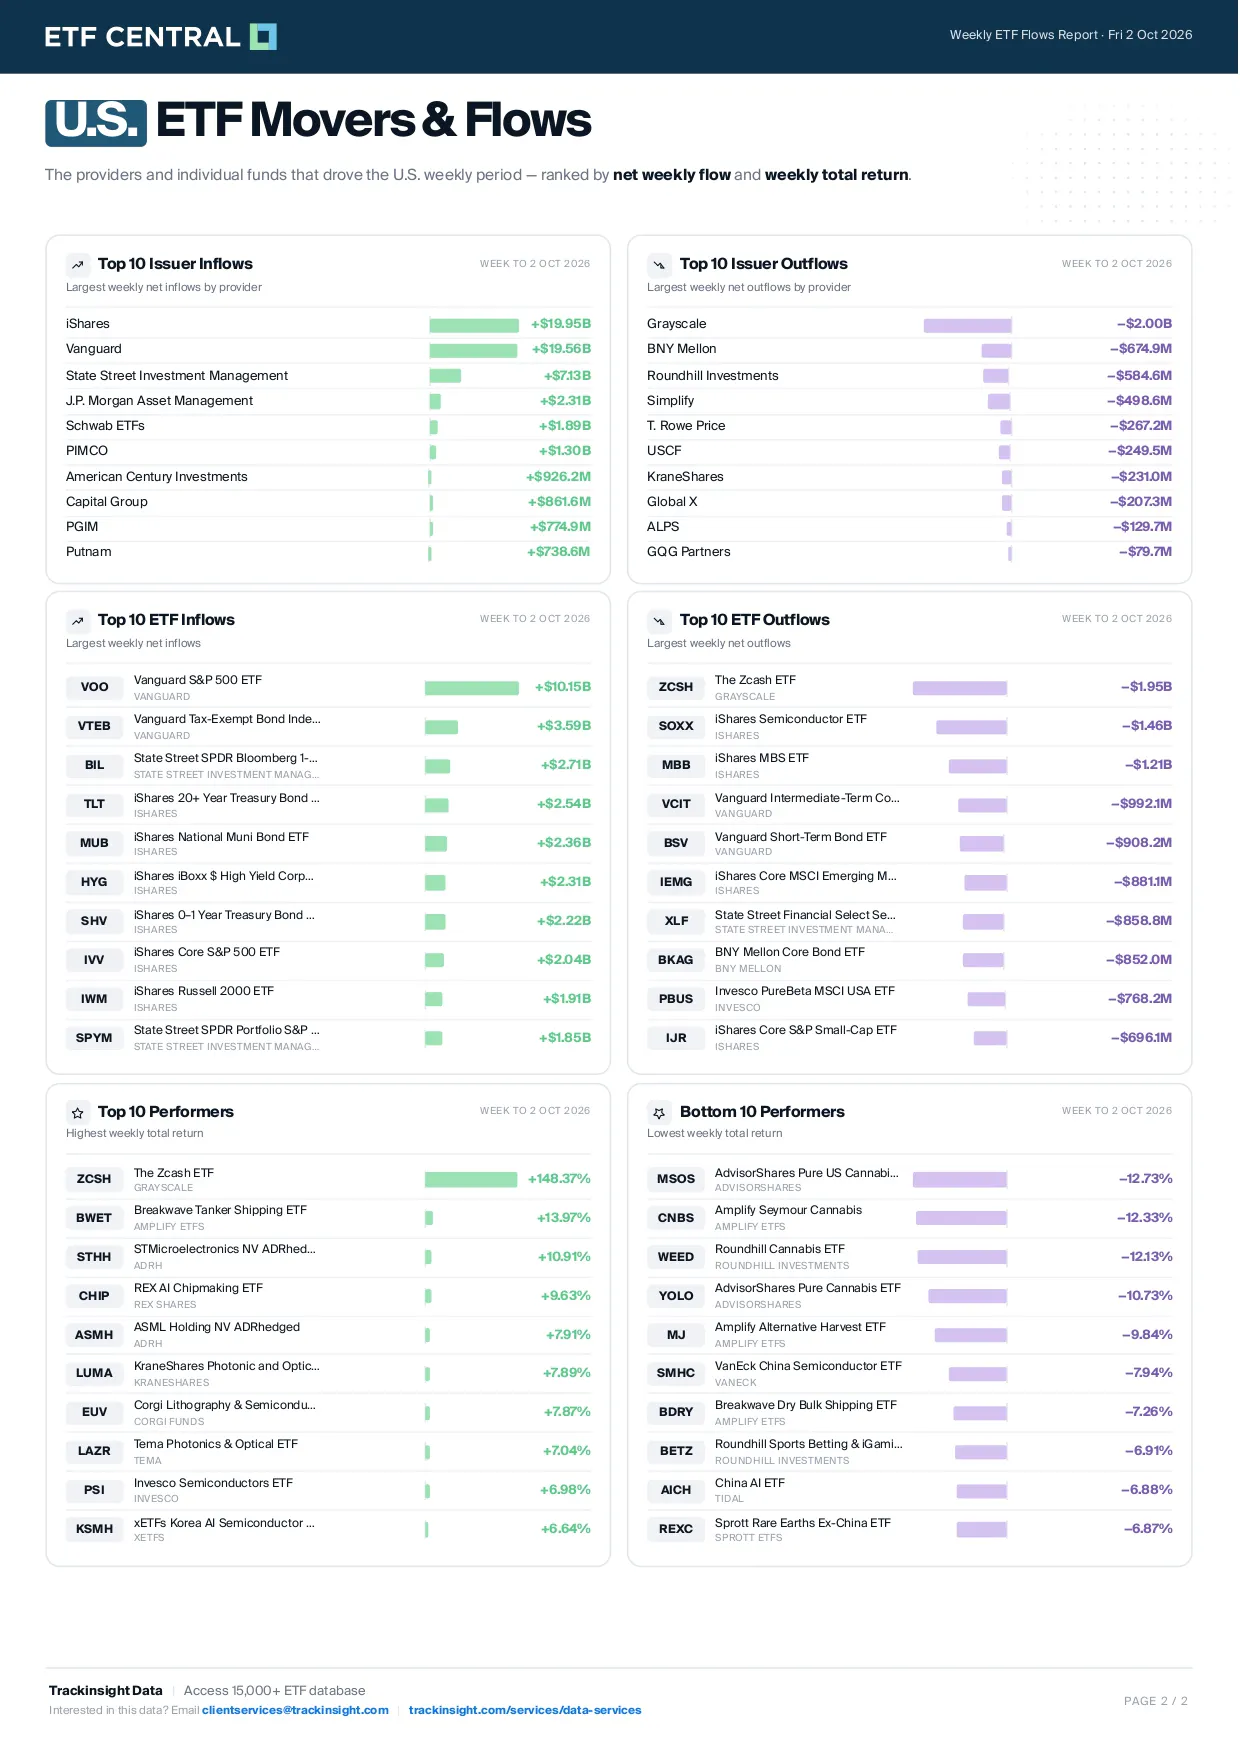
iShares led issuers with $19.95 billion in net inflows, narrowly ahead of Vanguard ($19.56B), followed by State Street Investment Management ($7.13B), J.P. Morgan Asset Management ($2.31B) and Schwab ETFs ($1.89B). PIMCO gathered $1.30 billion, while American Century Investments ($926.2M), Capital Group ($861.6M), PGIM ($774.9M) and Putnam ($738.6M) rounded out the top 10. Grayscale recorded the largest issuer outflow at $2.00 billion.
At the fund level, the Vanguard S&P 500 ETF (VOO) topped inflows with $10.15 billion, followed by the Vanguard Tax-Exempt Bond Index ETF (VTEB) with $3.59 billion and the State Street SPDR Bloomberg 1-3 Month T-Bill ETF (BIL) with $2.71 billion. The iShares 20+ Year Treasury Bond ETF (TLT) added $2.54 billion, while the iShares National Muni Bond ETF (MUB) gathered $2.36 billion and the iShares iBoxx $ High Yield Corporate Bond ETF (HYG) attracted $2.31 billion.
The Zcash ETF (ZCSH) recorded the largest fund outflow at $1.95 billion, followed by the iShares Semiconductor ETF (SOXX) at $1.46 billion and the iShares MBS ETF (MBB) at $1.21 billion.
Among equity ETFs, the STMicroelectronics NV ADRhedged (STHH) led weekly performance with a 10.91% gain, followed by the REX AI Chipmaking ETF (CHIP) at 9.63% and ASML Holding NV ADRhedged (ASMH) at 7.91%. Photonics and semiconductor strategies featured heavily among the week's leaders, with the KraneShares Photonic and Optical ETF (LUMA) gaining 7.89%, the Corgi Lithography & Semiconductor Photonics ETF (EUV) rising 7.87% and the Tema Photonics & Optical ETF (LAZR) advancing 7.04%.
At the bottom of the equity rankings, the AdvisorShares Pure US Cannabis ETF (MSOS) fell 12.73%, followed by the Amplify Seymour Cannabis ETF (CNBS) at -12.33% and the Roundhill Cannabis ETF (WEED) at -12.13%. The AdvisorShares Pure Cannabis ETF (YOLO) declined 10.73%, while the Amplify Alternative Harvest ETF (MJ) fell 9.84%.
Get data on 14,000+ ETFs
Access Trackinsight's reliable and comprehensive data with 500M+ points on 14,000+ ETFs.
About Trackinsight
Trackinsight is a global ETF data, analytics, research, and advisory firm serving professional investors, financial advisors, and institutions. Founded in 2016 and headquartered in Biot, France, the company operates across six countries and serves thousands of investment professionals. Since 2024, Trackinsight has been majority-owned by Kepler Cheuvreux and is part of ETF One, its integrated platform combining ETF Data Services, Research & Advisory, and Execution.
Please note that this article was generated using artificial intelligence based on Trackinsight data and is provided for informational purposes only. AI-generated content may contain errors, omissions, inaccuracies, or fabricated information and should not be relied upon without independent verification. Nothing in this article constitutes investment, financial, legal, or other professional advice. Investors should conduct their own due diligence and consult a qualified financial professional before making any investment decision.

Latest ETF News
See all ETF news
The Weekly ETF Market Monitor (September 21-25, 2026)
ETF News You Missed This Week - September 21 - 25, 2026

The Weekly ETF Market Monitor (September 14-18, 2026)
ETF News You Missed This Week - September 14 - 18, 2026

The Weekly ETF Market Monitor (September 7-11, 2026)

 Advantages of ETFs over Mutual Funds1/6
Lower Costs
In this guide, we'll explore the advantages of ETFs over mutual funds, giving you valuable insights into why ETFs have gained significant popularity among investors like yourself.
Leveraged ETFs: Unlocking the Potential for Amplified Returns1/6
Understanding Leveraged ETFs
Explore leveraged ETFs: potential for amplified returns & risks. 5 ETFs to consider across equities, commodities & fixed income.
What is a Leveraged ETF?1/6
Introducing Leveraged and Inverse ETFs
In this guide, we'll dive into the world of leveraged ETFs, exploring their definition, mechanics, potential risks, and rewards.
Recent educational content

ETF Trends
ETF Industry KPIs September 28, 2026
This week’s KPI data overview highlights key metrics and trends shaping the ETF landscape.

ETF Trends
ETF Industry KPIs September 22, 2026
This week’s KPI data overview highlights key metrics and trends shaping the ETF landscape.

First Look ETF
First Look ETF: Income, Corporate Arbitrage, and Growth and Value Investing
First Look ETF September 2026: iCapital, Mast Investments and North Square unpack new ETFs targeting monthly income, merger arbitrage and complementary growth and value exposure.

ETF Trends
ETF Industry KPIs September 14, 2026
This week’s KPI data overview highlights key metrics and trends shaping the ETF landscape.
Browse all educational columns



Have you tried our ETF Compare tool?
Compare ETFs like a pro. Analyze fees, performance, exposure & holdings side-by-side.