Open Now: The Global ETF Survey Take the Survey →



The Weekly ETF Market Monitor (July 13 - July 17, 2026)
A comprehensive snapshot of U.S. ETF market activity in Week 29 (July 13 - July 17, 2026), spanning flows, performance, sector and thematic trends, geographic exposures, asset classes, and leading funds and issuers.

Keep up with what matters in ETFs
Get timely ETF insights, market trends, and top ideas straight to your inbox.
Your newsletter subscriptions with us are subject to ETF Central's Privacy Policy and Terms and Conditions.
According to data by Trackinsight, U.S.-listed ETFs attracted $50.1 billion in net inflows during the week, led overwhelmingly by equity ETFs ($40.0B), while fixed income ETFs added $7.8B.
Technology remained the clear market favorite, pulling in $4.8B, followed by Financials ($2.3B) and Health Care ($964M). South Korea dominated country ETF flows, with EWY ranking as the second most purchased ETF of the week, underscoring continued investor enthusiasm for the country's semiconductor sector.
Get data on 14,000+ ETFs
Access Trackinsight's reliable and comprehensive data with 500M+ points on 14,000+ ETFs.
Japan also attracted strong inflows, while China-focused ETFs continued to see net outflows.
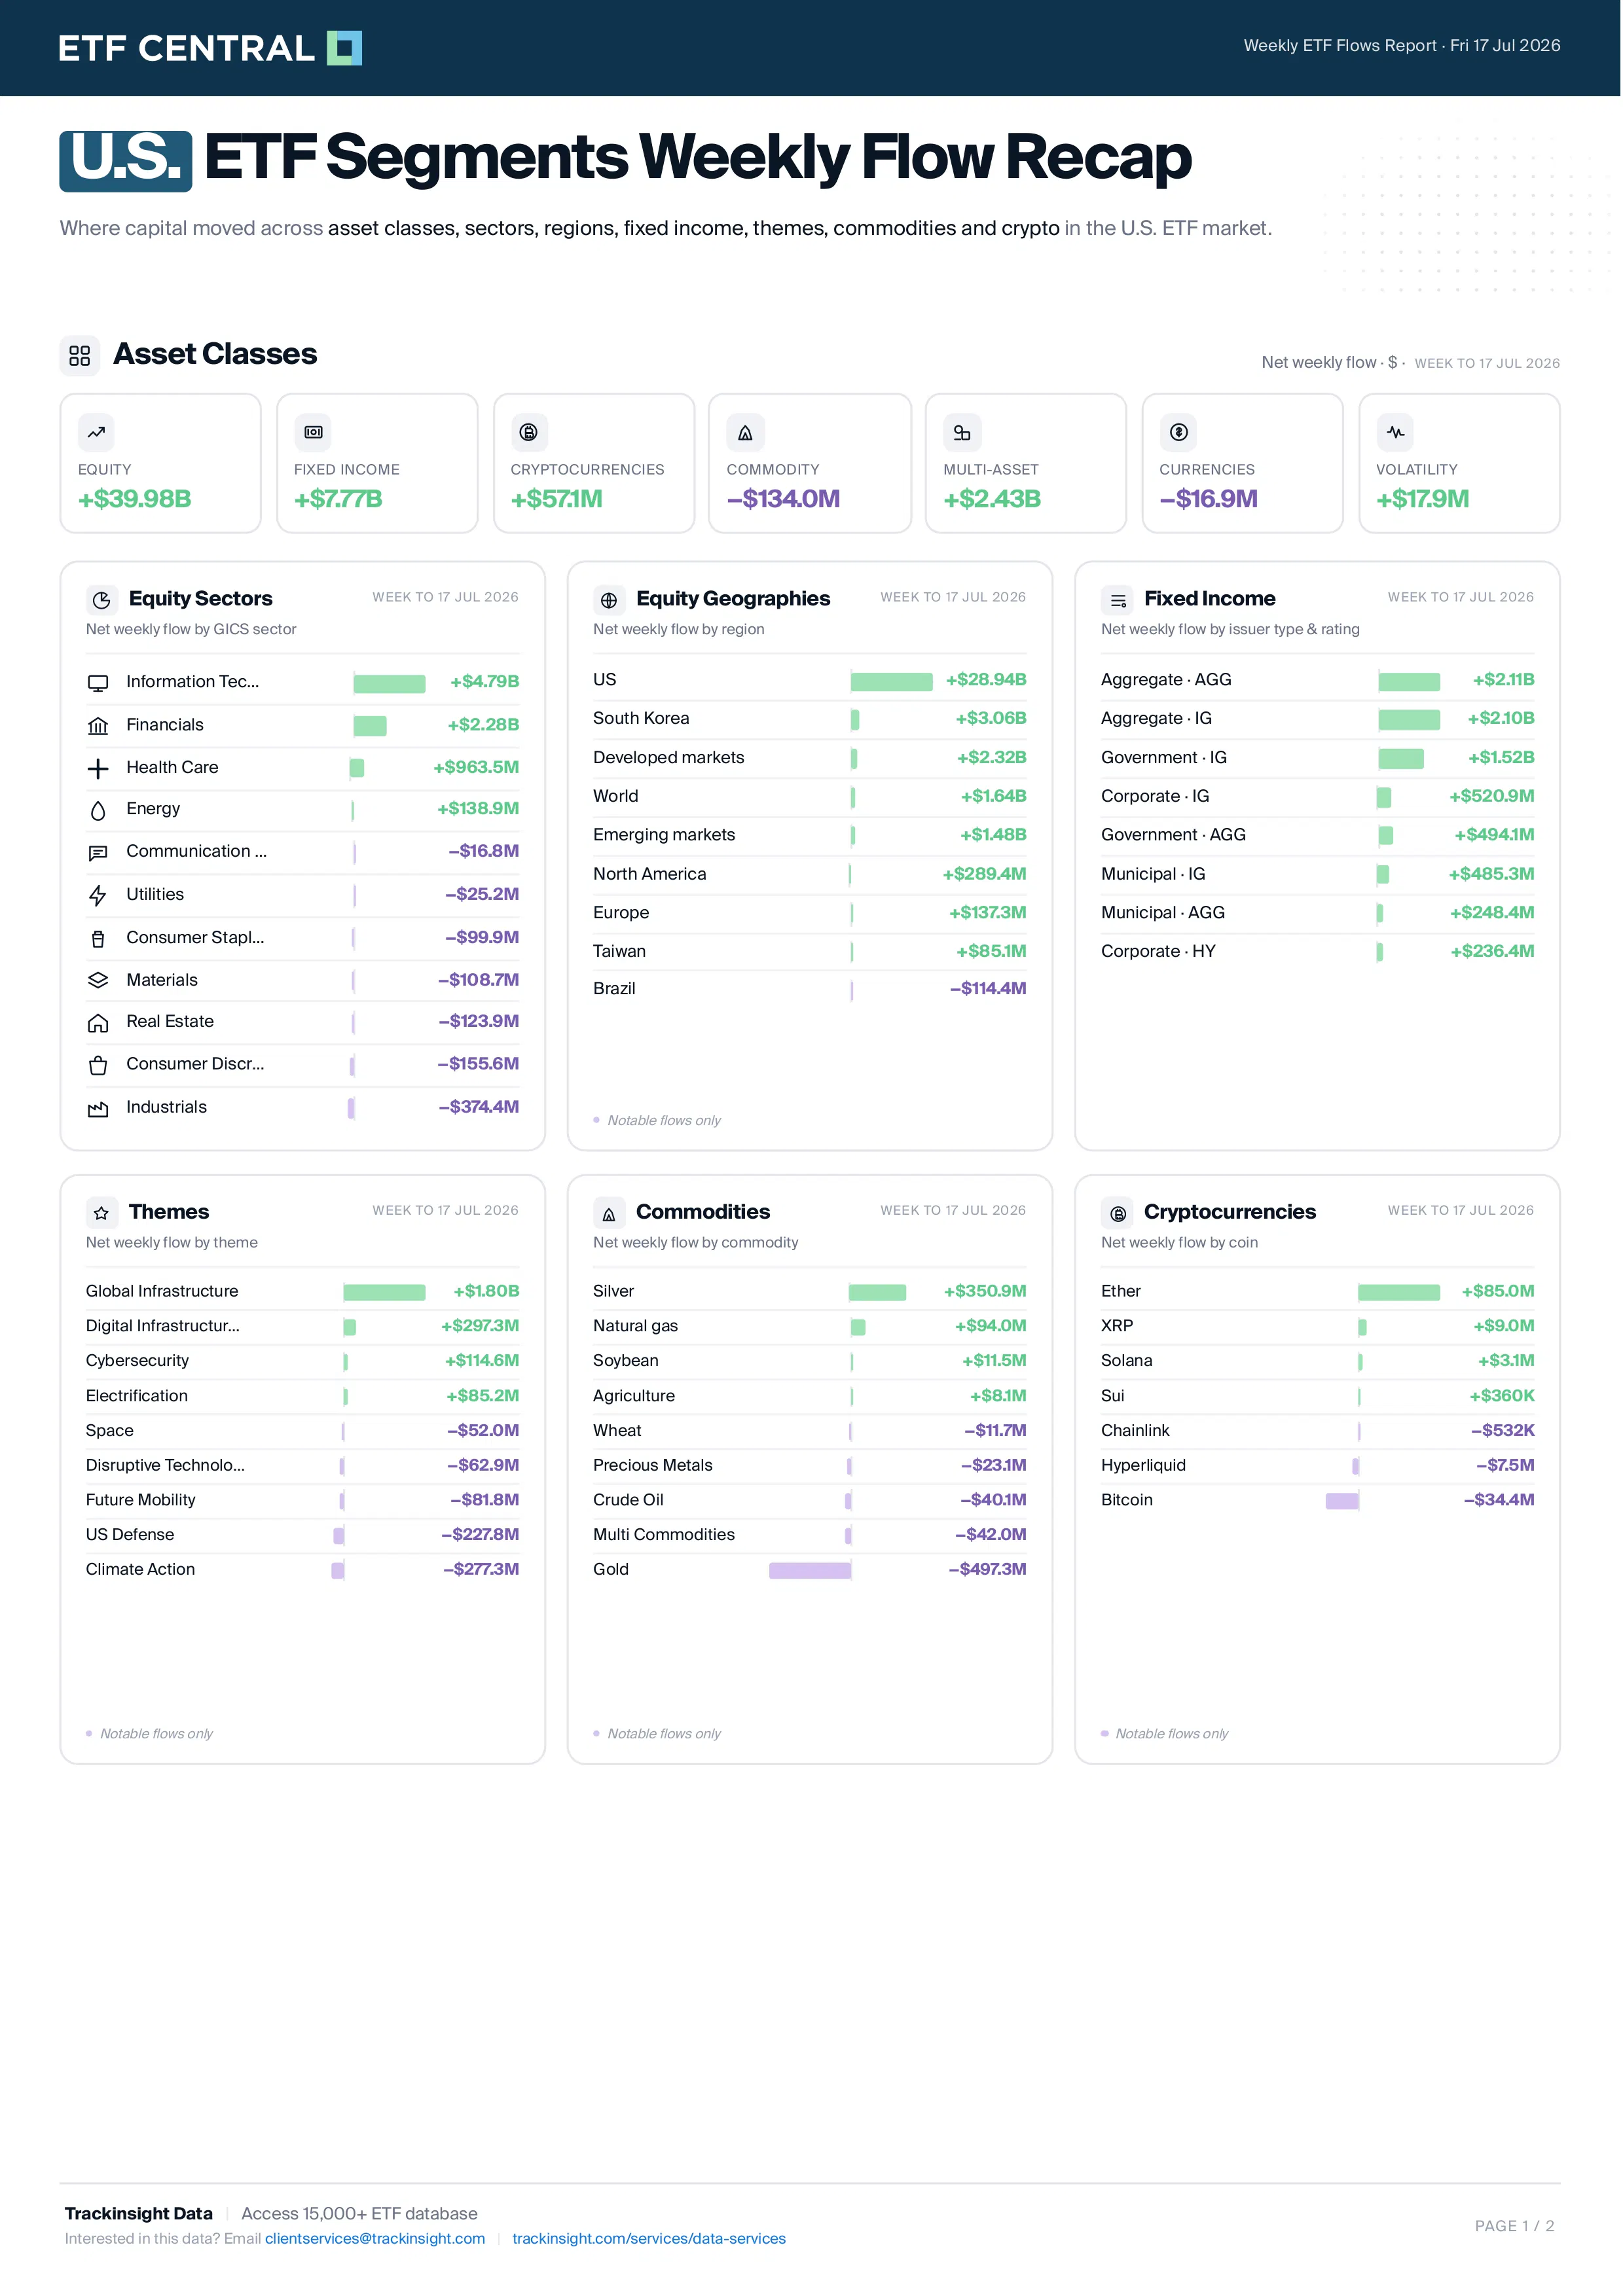
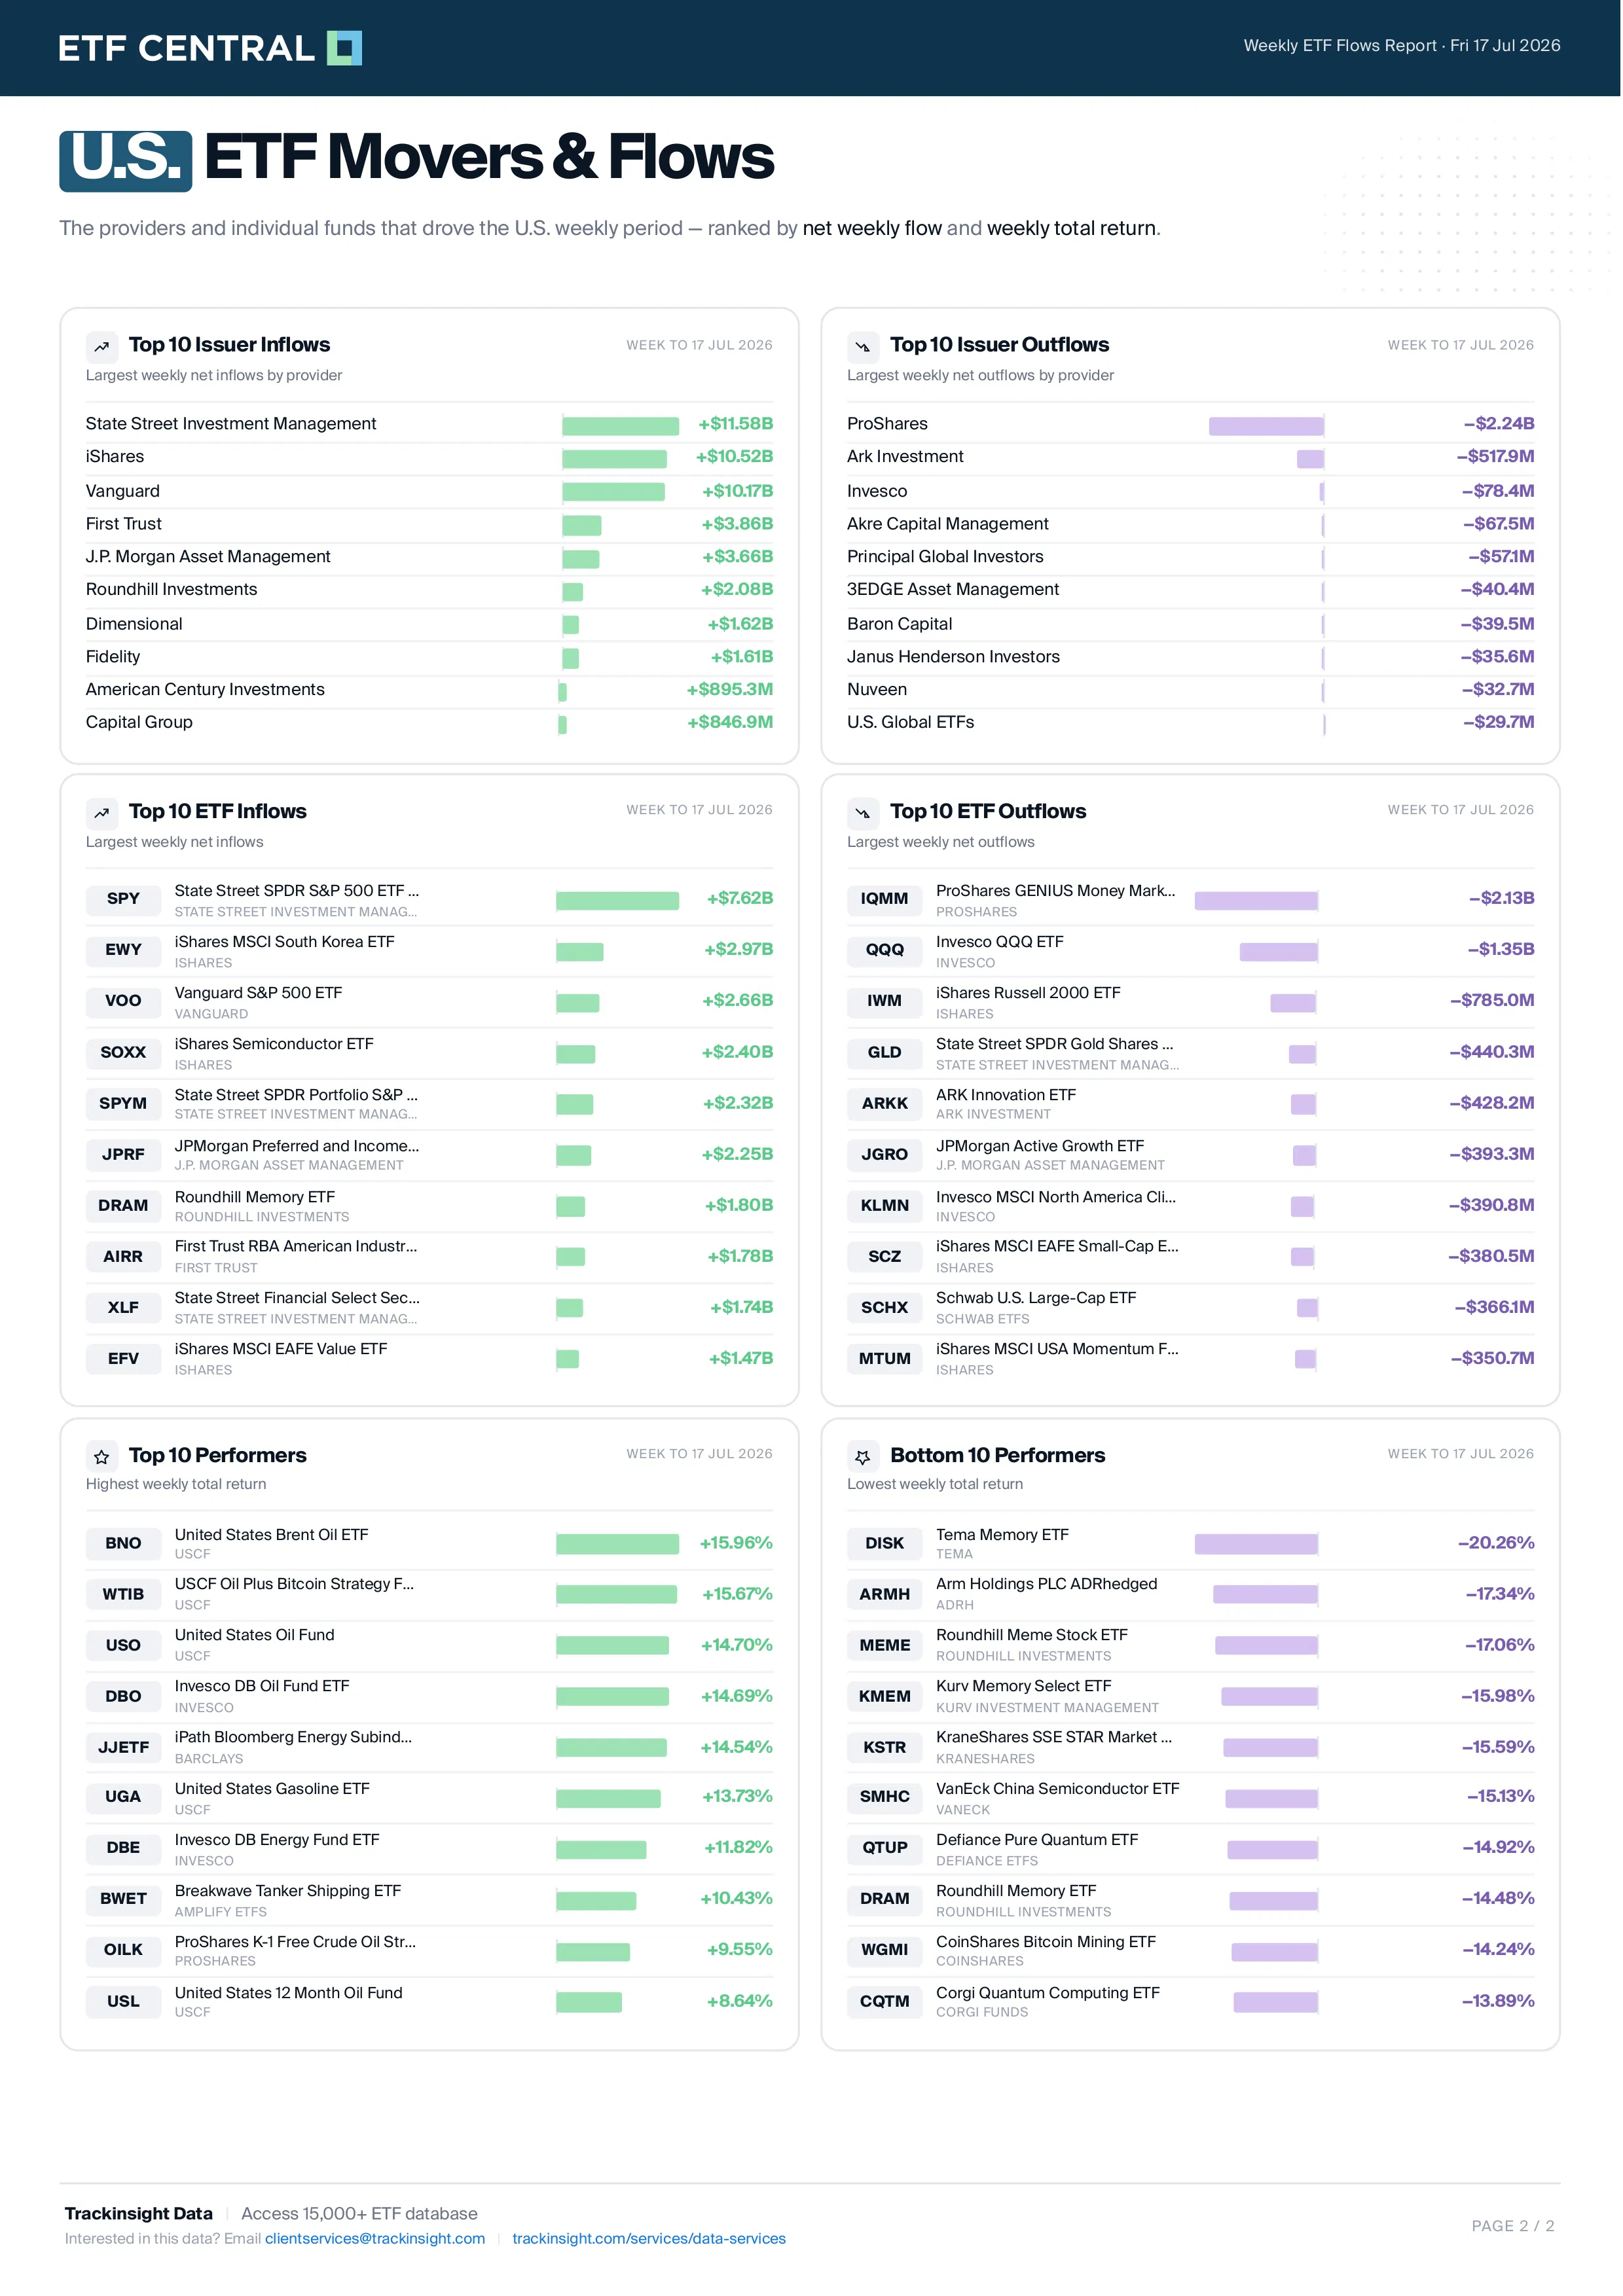
State Street Investment Management led all issuers with $11.6B of net inflows, ahead of iShares ($10.5B) and Vanguard ($10.2B). At the fund level, SPY, EWY, VOO, and SOXX topped the inflow rankings.
The week's strongest ETF performance came from the energy complex, with BNO (+16.0%), WTIB (+15.7%), USO (+14.7%), DBO (+14.7%), and BWET (+10.4%) leading gains as oil prices surged.
Please note this article is for information purposes only and does not in any way constitute investment advice. It is essential that you seek advice from a registered financial professional prior to making any investment decision.


Latest ETF News
See all ETF news


The Weekly ETF Market Monitor (June 22-26, 2026)

 Advantages of ETFs over Mutual Funds1/6
Lower Costs
In this guide, we'll explore the advantages of ETFs over mutual funds, giving you valuable insights into why ETFs have gained significant popularity among investors like yourself.
Leveraged ETFs: Unlocking the Potential for Amplified Returns1/6
Understanding Leveraged ETFs
Explore leveraged ETFs: potential for amplified returns & risks. 5 ETFs to consider across equities, commodities & fixed income.
What is a Leveraged ETF?1/6
Introducing Leveraged and Inverse ETFs
In this guide, we'll dive into the world of leveraged ETFs, exploring their definition, mechanics, potential risks, and rewards.
Recent educational content

ETF Trends
ETF Industry KPIs July 20, 2026
This week’s KPI data overview highlights key metrics and trends shaping the ETF landscape.

ETF Trends
ETF Industry KPIs July 13, 2026
This week’s KPI data overview highlights key metrics and trends shaping the ETF landscape.

First Look ETF
First Look ETF: Cash Deployment, Bond, and Hedged ETFs
In this season 6 episode of First Look ETF, Stephanie Stanton examines the latest ETF marketplace trends with NYSE and guests.

ETF Trends
ETF Industry KPIs July 6, 2026
This week’s KPI data overview highlights key metrics and trends shaping the ETF landscape.
Browse all educational columns



Active Trader Report: Use of Leveraged & Inverse ETFs Way Up
Direxion partnered with Compound Insights and Vanda to explore what’s driving the evolution of active trading — and how active traders are using leveraged and inverse funds across equities, single stocks, commodities, and volatility.