Open Now: The Global ETF Survey Take the Survey →



REIT Earnings Season Part III: The Losers
Commercial Mortgage and Hotel REITs took a hit, while Office and Self-Storage REITs struggled—discover the biggest losers and why.


Keep up with what matters in ETFs
Get timely ETF insights, market trends, and top ideas straight to your inbox.
Your newsletter subscriptions with us are subject to ETF Central's Privacy Policy and Terms and Conditions.
In Part 1 of our Earnings Recap - REIT Earnings Scorecard - we discussed the high-level takeaways from the roughly 200 equity REITs, mortgage REITs, and homebuilders. In Part 2, we discussed the Winners of REIT Earnings Season. Here in Part 3, we discuss the Losers of REIT Earnings Season.
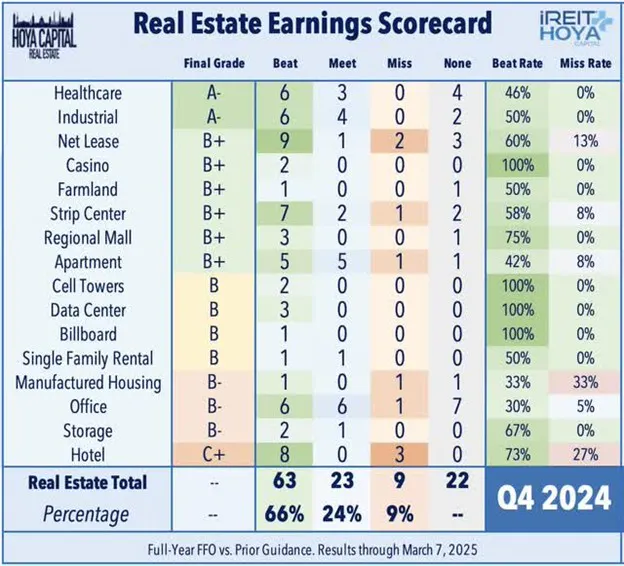
Buoyed by relief on the interest rate front and an uplift on "tariff immune" sectors, the Equity REIT Index has outperformed the S&P 500 by roughly 15 percentage points since the start of earnings season in mid-January. This outperformance follows a historically brutal three-year stretch in which REITs accumulated 50 percentage points of underperformance versus the broader index from the initial Fed rate hike in March 2022 through mid-January 2025. While interest rates and the tariff rotation have been the "spark" to the REIT rebound over the past two months, a very solid slate of earnings results provided the fuel. To summarize our Earnings Scorecard, REITs delivered one of the strongest overall earnings seasons in the past half-decade, with two-thirds of REITs reporting full-year FFO that exceeded guidance estimates.
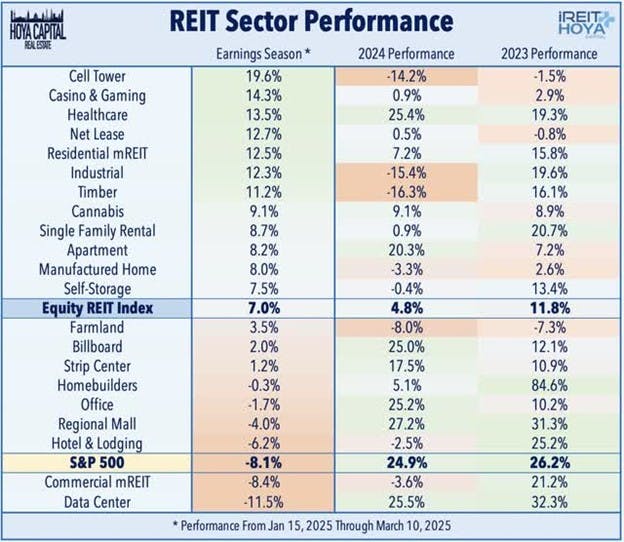
While there were few major "bombshells" at the sector-level this earnings season, Commercial Mortgage REITs were the "biggest loser" of REIT earnings season after results showed ongoing problems in the office space and a significant deterioration in multifamily bridge loan performance. Results from Hotel REITs were also disappointing given the sustained record-levels of travel demand in recent quarters, as margin pressures from higher labor costs have taken a sizable bite out of bottom-line FFO profitability. In a similar light, Office REIT results were also mildly disappointing, as an encouraging property-level recovery has been stymied by higher financing costs. Self-Storage REITs reported another quarter of double-digit declines in new lease rates, as home moving activity remains historically low as rates remain elevated. Billboard REITs reported solid results driven by a surge in political spending, but underlying ad spending trends will be tested amid a recent dip in business and consumer confidence. Takeaways from other REIT sectors were generally more positive than negative, including Single-Family Rental, Manufactured Housing, and Technology REIT sectors.
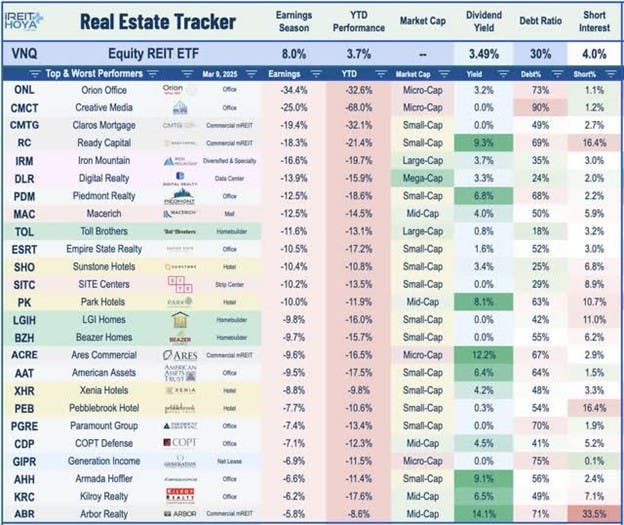
While dividend news was overwhelming positive this REIT earnings season - with 32 REITs raising their payouts - we did see five REITs reduce their dividends. Four of these names are among the worst-performing REITs this earnings season: office REIT Orion Office (ONL) has dipped 35% this earnings season after it slashed its dividend by 80%; commercial mREIT Ready Capital (RC) has dipped nearly 20% after cutting it dividend in half; Ares Commercial (ACRE) has dipped about 10% this earnings season after it slashed its payout by 40%; and Arbor Realty (ABR) has declined about 6% this earnings season after it indicated a 23% dividend cut next quarter. The fifth - Global Net Lease (GNL) - has been among the top-performing REITs as its 30% dividend cut came alongside a well-received portfolio sale as it continues to pay down debt. Below, we present a sector-by-sector breakdown with notes on incremental positives and negatives we've observed across the bottom-half of earnings grades this season.
Like what you're reading?
Stay in the loop — get the latest ETF insights: trends, analysis, and expert picks.
Loser #1: Commercial mREITs
Commercial mREITs: (Final Grade: C)
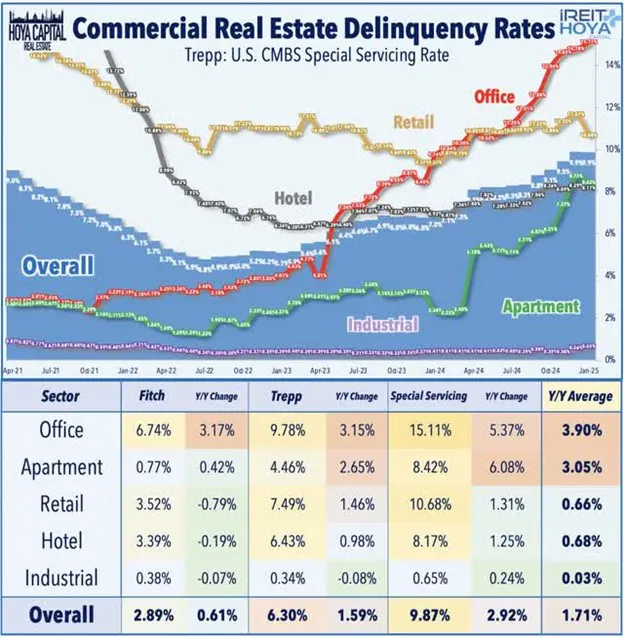
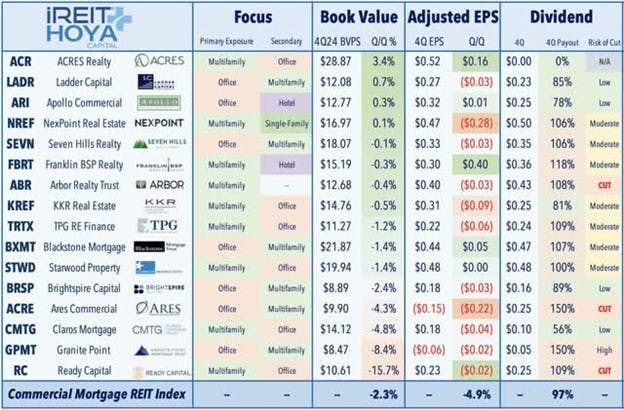
- Negatives: Significant deterioration in multifamily bridge loan performance resulting in dividend reductions from Arbor and Ready Capital, Poor outcomes in several office resolutions (write-offs in excess of CECL), Ares Commercial's life science downgrade (and dividend reduction), Granite Point's student housing downgrade, Claros Mortgage becomes meme stock.
- Positives: Blackstone Mortgage's "positive inflection" commentary, delinquency data showing a "bottoming" in late 2024, steady trends in retail and hotel loan performance, and higher-tier multifamily.
- Change in EPS: -4.9% | Change in Book Value: -2.3%
- Top Performer: Blackstone Mortgage (BXMT)
- Worst Performer: Ready Capital (RC)
Loser #2: Hotel REITs
Hotel: (Final Grade: C+)
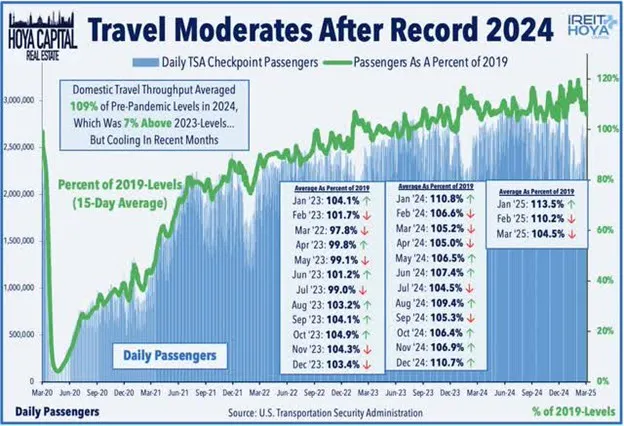
- Negatives: Margin headwinds in 2025 resulting from higher labor costs, zero average FFO growth in 2024 and 2025 despite record-setting travel demand, recent TSA data showing weaker trends in February and March, Average Daliy Rates have flatlined after substantial pandemic-era inflation, occupancy rates still marginally below 2019-levels.
- Positives: Reacceleration in Q4 travel demand after mid-year lull, ongoing recovery in group and business, Dividend hikes from Chatham & Xenia.
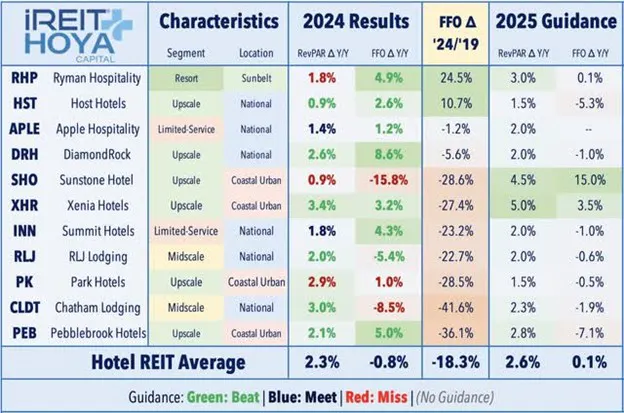
• FFO Guidance: 8 Beat, 3 Miss | 2025 Growth: +0.1%
• RevPAR Guidance: 6 Beat, 1 Meet, 3 Miss | 2025 Growth: +2.6%
• Top Performer: Apple Hospitality (APLE)
• Worst Performer: Sunstone Hotel (SHO)
Loser #3: Office REITs
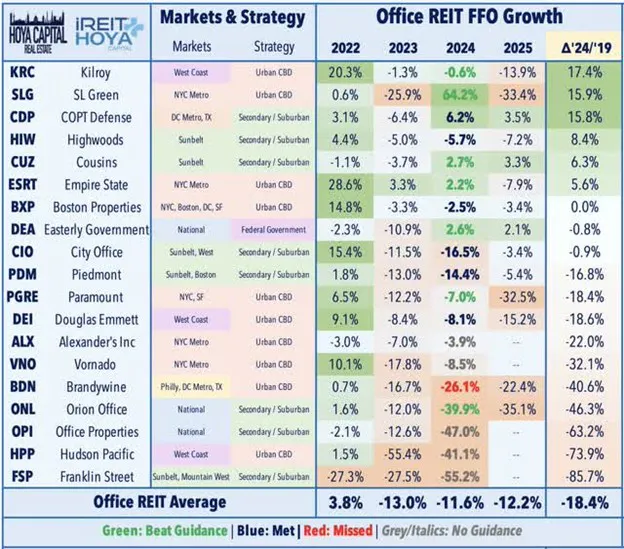
Office: (Final Grade: B-)
• Negatives: Disappointing 2025 FFO outlook calls for a third-straight year of double-digit average FFO declines, higher interest rate expense (BDN in particular) continues to offset improved property-level fundamentals, DOGE concerns hit government office REITs, concerns of softer leasing in early 2025 amid recent dip in business confidence, ONL's dividend cut.
• Positives: Leasing activity recovers to pre-pandemic average, Sequential uptick in occupancy for first time since 2022, Sunbelt & NYC strength, Cousins remains "unicorn" among office REITs, CDP dividend hike.
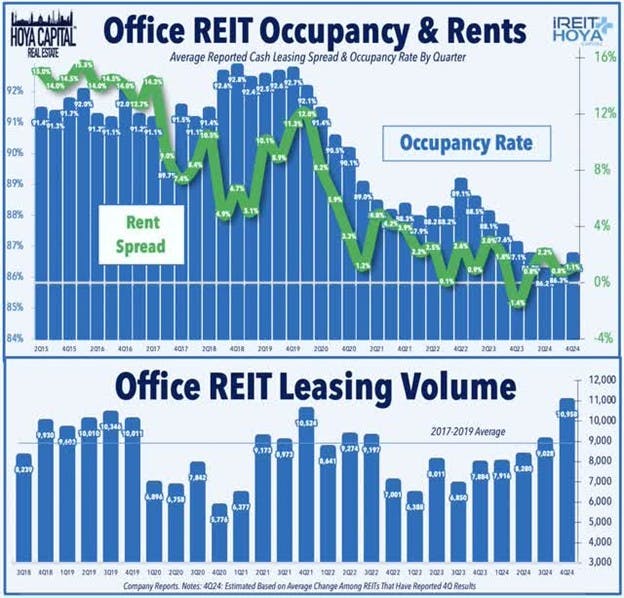
• FFO Guidance: 7 Beat, 6 Meet, 1 Miss (+40 bps Average)
• Top Performer: Hudson Pacific (HPP)
• Worst Performer: Orion Office (ONL)
Loser #4: Storage REITs
Self-Storage: (Final Grade: B-)
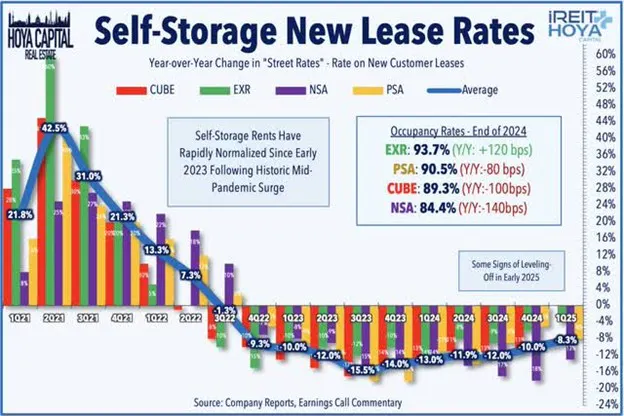
• Negatives: New lease rates ("Street Rates") remain in free-fall, No bottom yet for occupancy rates, EXR's expense jump in Q4 resulting from "outsized" increases in property taxes and marketing costs, Sunbelt remains soft after early-pandemic boom.
• Positives: Positive renewal rent growth despite sharply negative new lease rates, Upbeat commentary on supply growth, Relatively steady FFO and NOI in 2024 and 2025 given recent headwinds and early-pandemic boom, Notable round in Google search trend activity for self-storage.
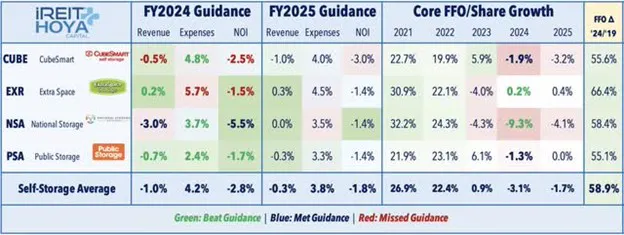
• FFO Guidance: 2 Beat, 2 Meet | 2025 Growth: -1.7%
• Top Performer: National Storage (NSA)
• Worst Performer: CubeSmart (CUBE)
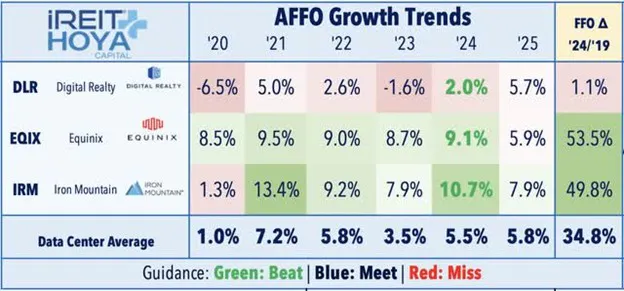
Loser #5: Data Center REITs
Data Center: (Final Grade: B)
• Negatives: Not immune from broader tech sell-off, softer bookings for DLR, moderating (but still solid) pricing power after record-setting 2024, IRM's disappointing 2025 bookings outlook and DOGE impacts.
• Positives: EQIX's record bookings in Q4, DLR's long-awaited return to FFO growth, upbeat DeepSeek and AI commentary, strong pricing power on smaller leases.
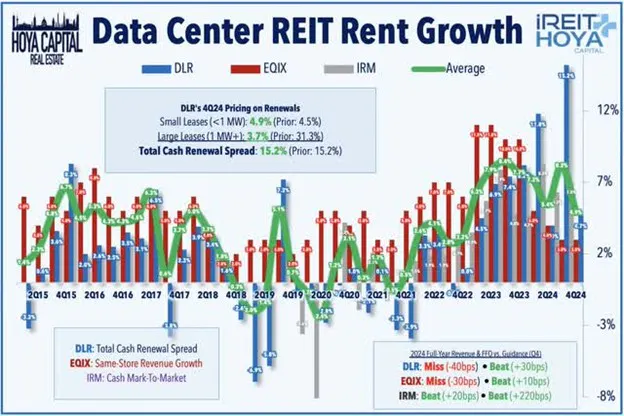
• FFO Guidance: 3 Beat | 2025 Growth: +5.8%
• Top Performer: Iron Mountain (IRM)
• Worst Performer: Equinix (EQIX)
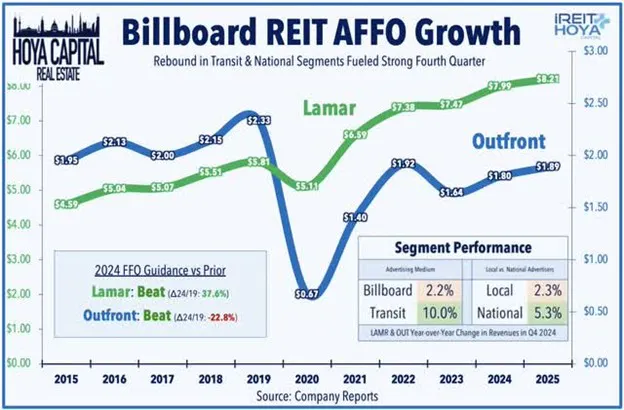
Loser #6: Billboard REITs
Billboard: (Final Grade: B)
• Negatives: Notable cooldown in the local segment in late 2024, moderation in same-store growth in static billboard segment, concerns that downbeat business sentiment could dampen spending in early 2025.
• Positives: Robust political spending drives recovery in the national segment, NYC drives impressive recovery in the transit segment, Digital conversions continue to catalyze growth, 10% dividend hike from Lamar.
Loser #7: Manufactured Housing REITs
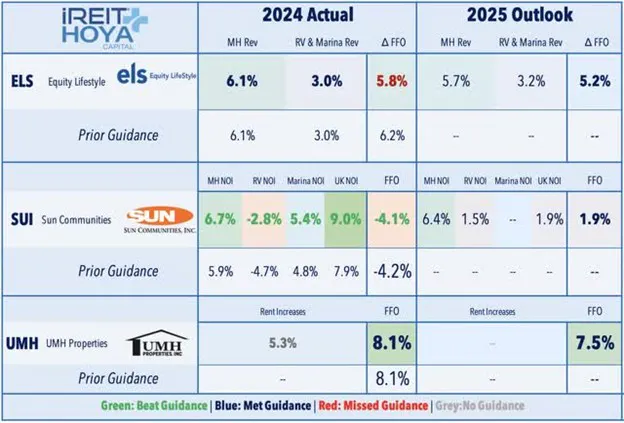
Manufactured Housing: (Final Grade: B)
• Negative: Transient and Season RV segments still a significant drag, Sun's UK division remains a major question mark, Marinas were consistently the best of the non-MH segments in same-store NOI growth.
• Positive: Core Manufactured Housing ("MH") segment remains very strong, Recreational Vehicle segment stabilizes, Sun sells Safe Harbors' marina division at healthy premium to focus on core business.
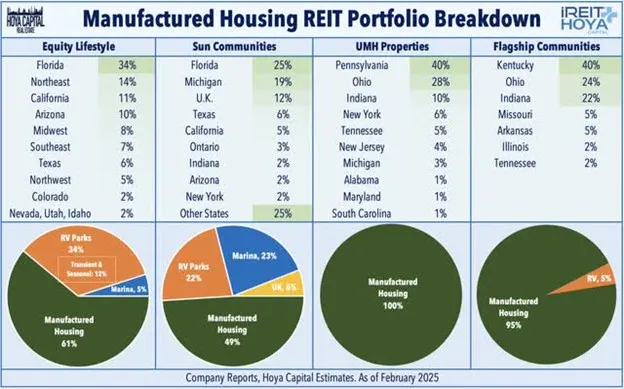
• FFO Guidance: 1 Beat, 1 Miss | 2025 Growth: +4.9%
• Top Performer: Sun Communities (SUI)
• Worst Performer: UMH Properties (UMH)
Loser #8: Single-Family Rental REITs
Single-Family Rental: (Final Grade: B)
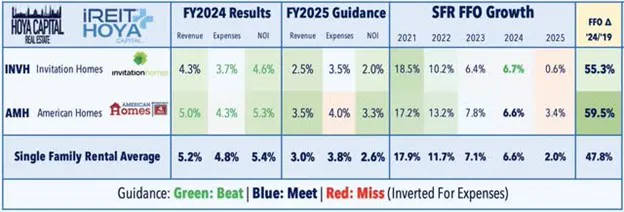
• Negatives: New lease rates turned negative in the fourth quarter, muted external growth in 2024, tariff concerns for AMH's homebuilding program, Softer trends noted in Central Florida, Texas, and Phoenix.
• Positives: Healthy FFO growth in 2024 & 2025 given recent housing market headwinds, Rent growth appears to be re-accelerating in early 2025 after a three-year deceleration, American Homes' 15% dividend hike.
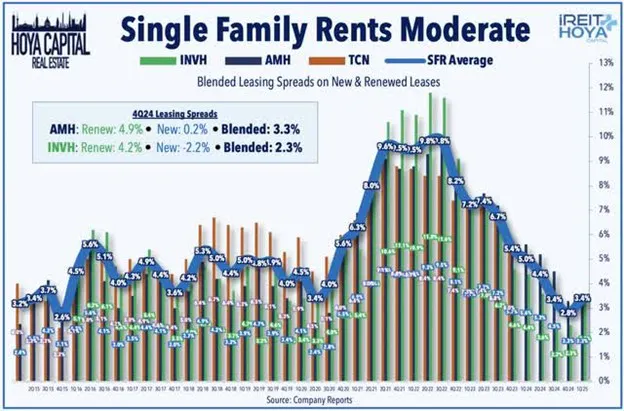
• FFO Guidance: 1 Beat, 1 Meet | 2025 Growth: +2.0%
• Top Performer: Invitation Homes (INVH)
• Worst Performer: American Homes (AMH)
Loser #9: Cell Tower REITs
Cell Tower: (Final Grade: Incomplete)
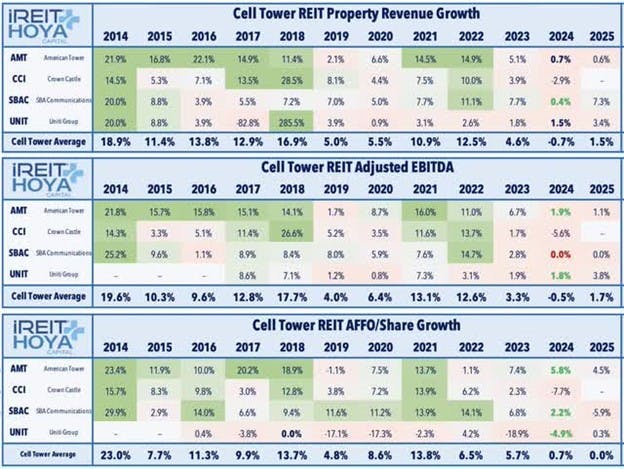
• Negatives: Delay in CCI's earnings report as it negotiates fiber sale, Zero average FFO growth in 2024 & 2025 after leading REIT sector 2015-2022.
• Positives: Better commentary on carrier investment activity, Recent bad press for Starlink - which has emerged as a legitimate disrupter to the traditional macro cell tower model, AMT and SBAC's dividend hike.
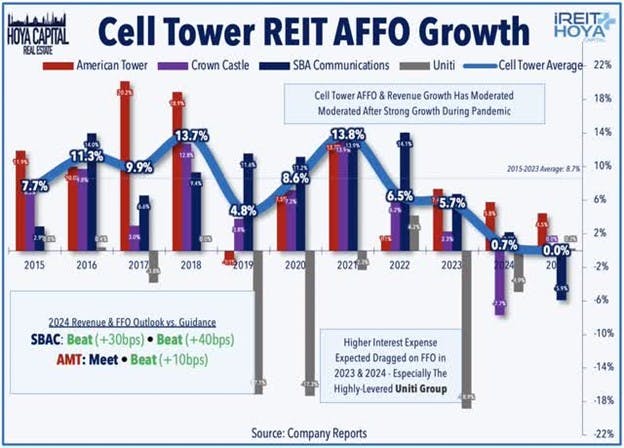
• FFO Guidance: 3 Beat | 2025 Growth: +0.0%
• Top Performer: American Tower (AMT)
• Worst Performer: Uniti Group (UNIT)
REIT Earnings Recap: Recession to Recovery
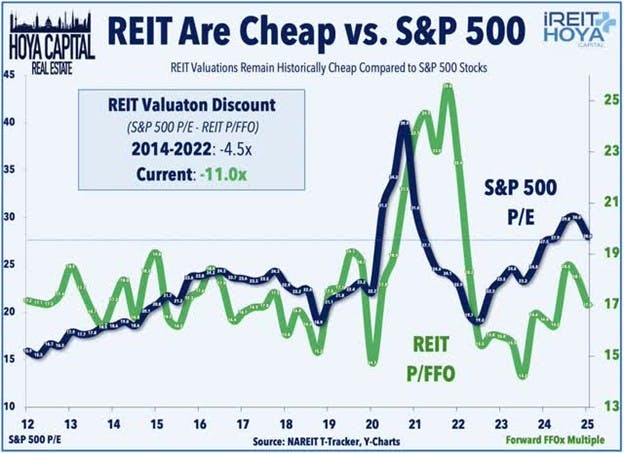
Real estate earnings results were consistent with our Recession to Recovery forecast last December in which we emphasized that valuations - not fundamentals - were responsible for the vast majority of REIT underperformance since early 2022, setting the stage for significant REIT outperformance in the quarters and years ahead as benchmark interest rates eventually normalize. While interest rates have been the "spark" to the REIT rebound over the past two months, a very solid slate of earnings results provided the fuel. One of the strongest overall REIT earnings season in the past half-decade, two-thirds of REITs reported full-year FFO that exceeded guidance estimates. Of note, REITs have delivered cumulative FFO growth of roughly 18% since the start of 2022 - not far behind that of the broader S&P 500 - during which time REIT stock price performance is effectively flat versus the 50%+ gains on the S&P 500, underscoring the historically compelling current valuations of REITs compared to the broader equity market.
About the Author
David Auerbach boasts over two decades of experience in the securities industry, specializing as an institutional trader with a focus on Real Estate Investment Trusts (REITs), Equity and Preferred stocks, MLPs, ETFs, and Closed End Funds.
Based in Dallas, TX throughout his entire career, David currently serves as the Chief Investment Officer for Hoya Capital, managing the Hoya Housing 100 ETF (Ticker: HOMZ) and The High Yield Dividend ETF (Ticker: RIET). Previously, David held the position of Managing Director at Armada ETF Advisors, the sub-advisor for the Residential REIT ETF (Ticker: HAUS) and The Private Real Estate Strategy via Liquid REITs ETF (Ticker: PRVT).
Additionally, he acts as a consultant with IRRealized, LLC, focusing on corporate access in the REIT industry. David's industry journey includes roles at World Equity Group, Esposito Securities, and Green Street Advisors where he got his start in the REIT industry.
At Esposito Securities, he played a crucial role in building the REIT/Real Estate platform and worked extensively with institutional investors, Equity REITs, and ETF issuers.
Throughout his career, David has been quoted by reputable publications such as Bloomberg, WSJ, Financial Times, REIT.com, and GlobeSt.com. He has also made notable appearances as a featured guest on networks like Yahoo Finance, TD Ameritrade, and Bloomberg.
David holds a BBA in Finance from the University of Texas at Austin (May 1999) and an MBA in Finance from Southern Methodist University (May 2005). He maintains FINRA Series 7, 24, 55, and 63 registrations.
In his leisure time, David is an avid traveler, often found crisscrossing the country in pursuit of attending as many Phish concerts as possible.
Disclaimer
Please note this article is for information purposes only and does not in any way constitute investment advice. It is essential that you seek advice from a registered financial professional prior to making any investment decision.
Segments
See all
Mentioned ETFs
No specific ETFs were tagged
Further reading
Latest ETF News
See all ETF news








 Advantages of ETFs over Mutual Funds1/6
Lower Costs
In this guide, we'll explore the advantages of ETFs over mutual funds, giving you valuable insights into why ETFs have gained significant popularity among investors like yourself.
Leveraged ETFs: Unlocking the Potential for Amplified Returns1/6
Understanding Leveraged ETFs
Explore leveraged ETFs: potential for amplified returns & risks. 5 ETFs to consider across equities, commodities & fixed income.
What is a Leveraged ETF?1/6
Introducing Leveraged and Inverse ETFs
In this guide, we'll dive into the world of leveraged ETFs, exploring their definition, mechanics, potential risks, and rewards.
Recent educational content

ETF Trends
ETF Industry KPIs July 13, 2026
This week’s KPI data overview highlights key metrics and trends shaping the ETF landscape.


First Look ETF
First Look ETF: Cash Deployment, Bond, and Hedged ETFs
In this season 6 episode of First Look ETF, Stephanie Stanton examines the latest ETF marketplace trends with NYSE and guests.

ETF Trends
ETF Industry KPIs July 6, 2026
This week’s KPI data overview highlights key metrics and trends shaping the ETF landscape.

Asset TV
The ETF Show - The Evolution of Leveraged & Inverse ETFs
Leveraged and inverse ETFs have exploded in popularity over the past decade capturing more assets as retail traders seek to capture volatility.

Browse all educational columns



Build and Analyze Your ETF Portfolio Like a Pro
Create your own ETF portfolio in minutes and instantly see allocations, exposures, performance, and risk. Visualize diversification across asset classes, regions, and sectors. Stress-test ideas, compare benchmarks, and refine your strategy with professional-grade analytics.
