ETF model portfolios designed for real investor needs. Discover →



NYSE MAC Desk - December 2 Weekly Recap
Coming into this week major US indices had spent the previous two weeks consolidating in a tight range following the better than expected CPI data. Last week in holiday shortened trade both the S&P 500 and the Dow Jones Industrial Average rallied ~1.5% testing the upper end of that range.


Keep up with what matters in ETFs
Get timely ETF insights, market trends, and top ideas straight to your inbox.
Your newsletter subscriptions with us are subject to ETF Central's Privacy Policy and Terms and Conditions.
STRAIGHT FROM THE TRADING FLOOR
by Michael Reinking, CFA - Sr. Market Strategist
Get data on 14,000+ ETFs
Access Trackinsight's reliable and comprehensive data with 500M+ points on 14,000+ ETFs.
DOW 34,430 (+35), S&P 500 4,072 (-5), Russell 2000 1,893 (+11), NYSE FANG+ 4,961 (+44), ICE Brent Crude $85.55/barrel (-$1.33), Gold $1,811/oz (-$4), Bitcoin ~16.9k (+105)
Coming into this week major US indices had spent the previous two weeks consolidating in a tight range following the better than expected CPI data. Last week in holiday shortened trade both the S&P 500 and the Dow Jones Industrial Average rallied ~1.5% testing the upper end of that range. We started off the week giving back most of those gains ahead of Chair Powell's speech at the Brookings Institute and this week's employment data. Those catalysts created some volatility but at the end of the day major indices ended the week modestly higher with the S&P 500 and Russell 2k up ~1% while the Dow Jones Industrial Average ended the week around unchanged.
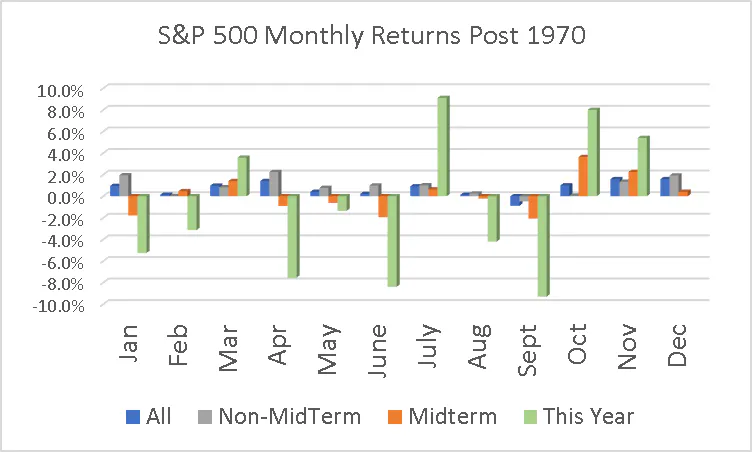
Throughout this year we have been talking about seasonality associated with midterm election years. Heading into October we had highlighted that the seasonal headwinds were turning into tailwinds given the very strong historical return profiles of October/November. That has played out with the S&P 500 rallying 8% in October followed by a 5.4% rally in November. Broadly speaking December tends to be a good month for equity markets, as Santa Claus comes to town, but the track record in mid-term election years is not quite as strong. Since 1970 in December following a midterm election the average return for the S&P 500 is 0.4% up ~60% of the time relative to a 1.9% average gain up in ~80% of instances in non midterm years (see updated chart below).
The big outperformer this week was the NYSE FANG+ index which ended the week higher by >7% driven primarily by gains in the China components, as both BABA/BIDU ended the week up >20%. China has been a focal point for the last few weeks and despite ongoing protests markets have continued to rally as there are signs that the government is taking incremental steps to ease its Covid policy and support their property markets. The Hong Kong Hang Seng Index was up >6% this week capping off a 26.6% rally in the month of November. The China Shanghai Composite was up 1.9% this week and ~9% last month.
Read the rest of the weekly recap here

Latest ETF News
See all ETF newsMoneyShow Chart of the Day 9/4/26: Don't Just Watch Oil. Watch THESE.


Chart of the Day 8/14/26: The Great "Hot Money" Migration

MoneyShow Chart of the Day 7/29/26: Now, THAT's What I Call Market Rotation!

MoneyShow Chart of the Day 7/16/26: Good News/Bad News on Inflation (and the Fed)




 Advantages of ETFs over Mutual Funds1/6
Lower Costs
In this guide, we'll explore the advantages of ETFs over mutual funds, giving you valuable insights into why ETFs have gained significant popularity among investors like yourself.
Leveraged ETFs: Unlocking the Potential for Amplified Returns1/6
Understanding Leveraged ETFs
Explore leveraged ETFs: potential for amplified returns & risks. 5 ETFs to consider across equities, commodities & fixed income.
What is a Leveraged ETF?1/6
Introducing Leveraged and Inverse ETFs
In this guide, we'll dive into the world of leveraged ETFs, exploring their definition, mechanics, potential risks, and rewards.
Recent educational content

ETF Trends
ETF Industry KPIs September 8, 2026
This week’s KPI data overview highlights key metrics and trends shaping the ETF landscape.

ETF Trends
ETF Industry KPIs August 31, 2026
This week’s KPI data overview highlights key metrics and trends shaping the ETF landscape.
ETF Trends
ETF Industry KPIs August 24, 2026
This week’s KPI data overview highlights key metrics and trends shaping the ETF landscape.
What’sTheFund
What's the Fund | Ocean Park Diversified Income ETF (DUKZ)
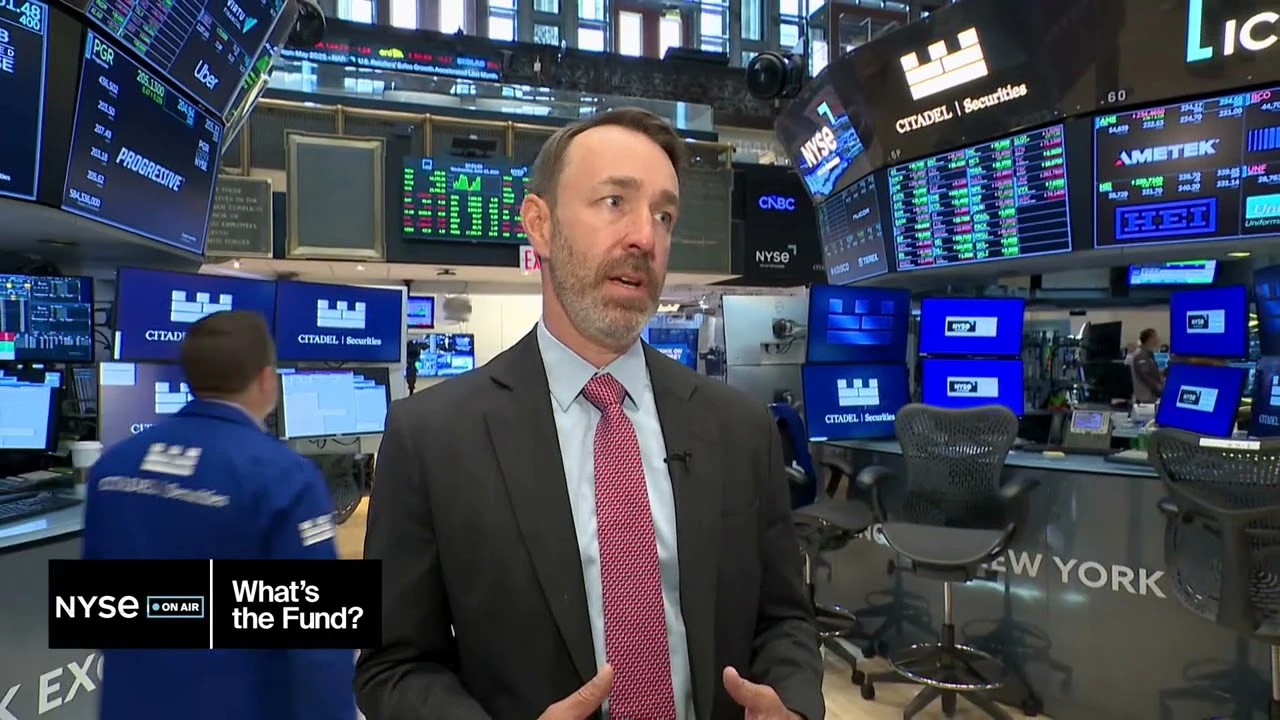
James St Aubin, Chief Investment Officer at Ocean Park Asset Management, discuss the DUKZ ETF, exposing investors to the whole spectrum of asset classes in the fixed income markets, through their rules-based process.

Browse all educational columns



Expert-Built ETF Portfolios, All in One Place
Don’t start from scratch. Discover ready-made ETF portfolios built by professionals to match different goals, timelines, and market views. Use them as inspiration or as a starting point for your own allocation.