Turn ETF ideas into real portfolios. Try the builder now →



ETF Market Weekly Trends: Tech Dominates, Argentina Surges, and Gold Slips
In this week 44 ETF Market Weekly Trends report, we break down the biggest flow drivers, sector moves, and investor themes shaping U.S. markets.


Keep up with what matters in ETFs
Get timely ETF insights, market trends, and top ideas straight to your inbox.
Your newsletter subscriptions with us are subject to ETF Central's Privacy Policy and Terms and Conditions.
According to data from our partner Trackinsight, U.S. ETF markets saw strong inflows, led by equities at $36.8 billion. Fixed income followed with $8.9 billion, while commodities lost $1.5 billion. Smaller moves came from other asset classes, with a modest $30 million entering cryptocurrency ETFs and $84 million exiting the “Other” category.
Get data on 14,000+ ETFs
Access Trackinsight's reliable and comprehensive data with 500M+ points on 14,000+ ETFs.
Technology Takes the Spotlight
The Information Technology sector led performance with a 2.424% gain, while Consumer Staples (-3.536%), Real Estate (-3.415%), and Utilities (-2.524%) trailed behind.
In flows, technology funds stood out again, attracting $4.0 billion, while Utilities and Real Estate added $149 million and $93 million respectively.
Outflows hit several sectors, with Consumer Discretionary (-$584 million), Consumer Staples (-$333 million), and Communication Services (-$224 million) among the largest.
Regional Winners and Losers
Among country ETFs, Argentina surged 26.9%, followed by South Korea (+5.8%), Chile (+2.8%), and Latin America (+2.7%).
On the weaker end, Iceland (-4.8%), Vietnam (-3.9%), and Switzerland (-2.9%) posted declines.
In flows, the U.S. led with $18.4 billion, supported by Developed Markets (+$2.9 billion), World (+$1.1 billion), and Emerging Markets (+$856 million).
Outflows appeared in Canada (-$92 million), Mexico (-$60 million), Australia (-$59 million), and Hong Kong (-$33 million).
Thematic ETFs See Strong Momentum
Thematic performance was led by Hydrogen Economy (+7.618%), Nuclear Energy (+7.025%), and Life Sciences (+6.369%).
Other notable gains came from Artificial Intelligence & Big Data (+4.725%), Future Mobility (+3.411%), and Battery Value-Chain (+3.307%).
Weakness appeared in Cannabis & Psychedelics (-6.073%), Timber & Forestry (-4.176%), and Branding and Luxury (-3.918%).
Flows into themes were dominated by Artificial Intelligence & Big Data ($386 million), followed by Digital Infrastructure & Connectivity ($300 million), Disruptive Technology ($222 million), and U.S. Defense ($201 million).
Outflows were led by Travel Technology & Services (-$65 million) and Blockchain (-$52 million).
Fixed Income Flows Highlight Quality Preference
Within fixed income ETFs, the strongest inflows centered on investment-grade segments. Corporate Investment Grade funds led with $2.26 billion, followed by Aggregate Investment Grade ($2.09 billion) and Government Investment Grade ($1.65 billion).
Aggregate Aggregate strategies added another $1.53 billion, while Municipal Investment Grade gained $910 million.
High-yield strategies saw healthy demand too, with Corporate High Yield collecting $861 million. Outflows were limited to government-backed areas, as Government Agencies Investment Grade slipped $664 million, and Government Aggregate lost $122 million.
Commodity ETFs See Gold Outflows
Commodity ETFs continued to face pressure, led by significant withdrawals from precious metals. Gold ETFs recorded $1.34 billion in outflows, while Silver ETFs lost $310 million, extending recent weakness in the segment.
Crypto ETF Flows Turn Mixed
Flows into crypto-linked ETFs were split across digital assets.
Solana stood out with $465 million in inflows, followed by Hedera ($45 million), XRP ($13 million), and Ether ($8 million). Bitcoin ETFs, however, saw heavy redemptions totaling $507 million, offsetting much of the week’s digital asset inflows.
Top Performing ETFs of the Week
- Global X MSCI Argentina ETF (ARGT): +26.925%
- Sprott Uranium Miners ETF (URNM): +10.482%
- ADRH GSK p.l.c – USD Hedged (GSKH): +9.310%
- Sprott Junior Uranium Miners ETF (URNJ): +9.150%
- Roundhill Uranium ETF (UX): +8.224%
- Global X Hydrogen ETF (HYDR): +7.618%
- Global X Uranium ETF (URA): +7.476%
- F/m Emerald Life Sciences Innovation ETF (LFSC): +6.369%
- Franklin FTSE South Korea ETF (FLKR): +6.253%
- ALPS Medical Breakthroughs ETF (SBIO): +6.246%
Top ETF Inflows of the Week
- Akre Capital Management (AKRE): $10.82 billion
- SPDR S&P 500 ETF Trust (SPY): $4.42 billion
- Vanguard S&P 500 ETF (VOO): $4.30 billion
- Vanguard Information Technology ETF (VGT): $2.13 billion
- Vanguard Total Stock Market ETF (VTI): $1.17 billion
- Invesco NASDAQ 100 ETF (QQQM): $1.16 billion
- Schwab U.S. Large-Cap Growth ETF (SCHG): $1.16 billion
- Vanguard FTSE Developed Markets ETF (VEA): $806 million
- Vanguard Growth ETF (VUG): $679 million
- iShares iBoxx $ Investment Grade Corporate Bond ETF (LQD): $659 million
Notable Issuer Flows of the Week
- Vanguard: $13.60 billion
- Akre Capital Management: $10.82 billion
- iShares: $3.38 billion
- SPDR: $2.85 billion
- Schwab ETFs: $2.55 billion
- J.P. Morgan Asset Management: $1.71 billion
- Invesco: $1.36 billion
- Capital Group: $1.29 billion
- First Trust: $721 million
- American Century Investments: $715 million
- Bondbloxx Investment Management: -$249 million
- PACER ETFs: -$244 million
- WisdomTree: -$140 million
- Barclays: -$123 million
- Direxion: -$116 million
- PGIM: -$109 million
Please note this article is for information purposes only and does not in any way constitute investment advice. It is essential that you seek advice from a registered financial professional prior to making any investment decision.
Segments
See all
No specific market segments were tagged
Mentioned ETFs
No specific ETFs were tagged
Further reading


Latest ETF News
See all ETF newsThe Weekly ETF Market Monitor (August 31- September 4, 2026)
ETF News You Missed This Week - August 31 - September 4, 2026

The Weekly ETF Market Monitor (August 24-28, 2026)
ETF News You Missed This Week - August 24 - 28, 2026

The Weekly ETF Market Monitor (August 17-21, 2026)
ETF News You Missed This Week - August 17 - 21, 2026


 Advantages of ETFs over Mutual Funds1/6
Lower Costs
In this guide, we'll explore the advantages of ETFs over mutual funds, giving you valuable insights into why ETFs have gained significant popularity among investors like yourself.
Leveraged ETFs: Unlocking the Potential for Amplified Returns1/6
Understanding Leveraged ETFs
Explore leveraged ETFs: potential for amplified returns & risks. 5 ETFs to consider across equities, commodities & fixed income.
What is a Leveraged ETF?1/6
Introducing Leveraged and Inverse ETFs
In this guide, we'll dive into the world of leveraged ETFs, exploring their definition, mechanics, potential risks, and rewards.
Recent educational content

ETF Trends
ETF Industry KPIs September 8, 2026
This week’s KPI data overview highlights key metrics and trends shaping the ETF landscape.

ETF Trends
ETF Industry KPIs August 31, 2026
This week’s KPI data overview highlights key metrics and trends shaping the ETF landscape.
ETF Trends
ETF Industry KPIs August 24, 2026
This week’s KPI data overview highlights key metrics and trends shaping the ETF landscape.
What’sTheFund
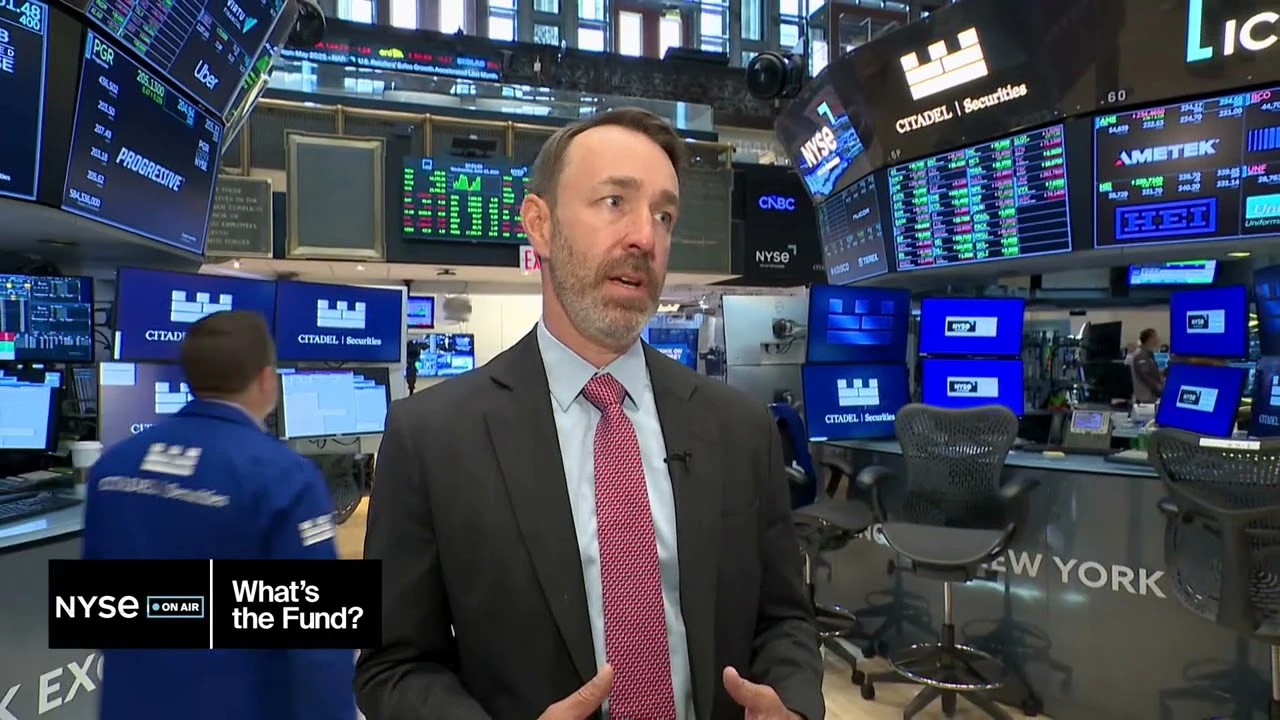
What's the Fund | Ocean Park Diversified Income ETF (DUKZ)
James St Aubin, Chief Investment Officer at Ocean Park Asset Management, discuss the DUKZ ETF, exposing investors to the whole spectrum of asset classes in the fixed income markets, through their rules-based process.

Browse all educational columns



Build and Analyze Your ETF Portfolio Like a Pro
Create your own ETF portfolio in minutes and instantly see allocations, exposures, performance, and risk. Visualize diversification across asset classes, regions, and sectors. Stress-test ideas, compare benchmarks, and refine your strategy with professional-grade analytics.
