Turn ETF ideas into real portfolios. Try the builder now →



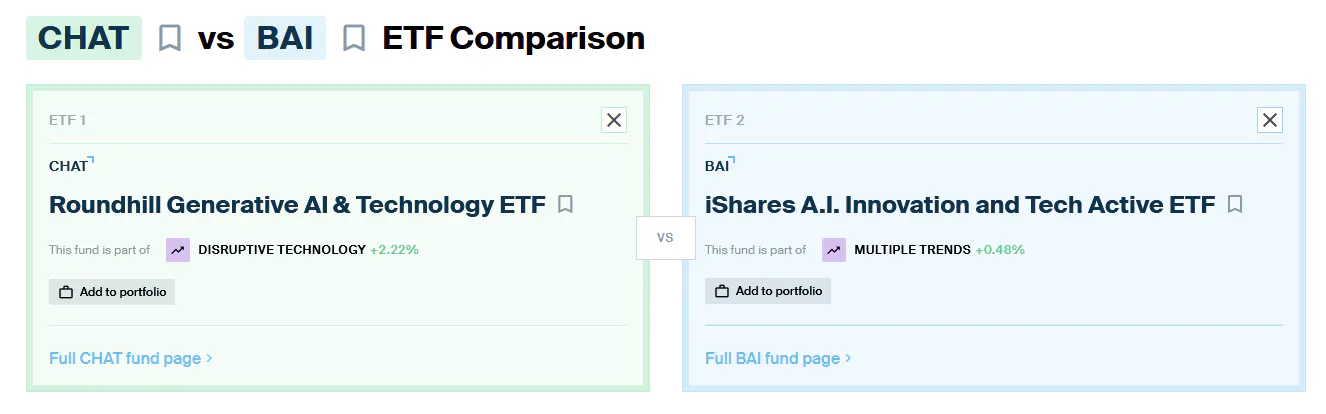
ETF Comparison: Roundhill Generative AI & Technology ETF Versus iShares A.I. Innovation and Tech Active ETF
Two of the largest and best-performing artificial intelligence thematic ETFs go head-to-head in this week’s ETF comparison.

Keep up with what matters in ETFs
Get timely ETF insights, market trends, and top ideas straight to your inbox.
Your newsletter subscriptions with us are subject to ETF Central's Privacy Policy and Terms and Conditions.
It's my view that thematic investing is one area where active management can still hold a meaningful advantage, and a large part of that comes down to fees.
While newer issuers such as Corgi ETFs have begun launching lower-cost thematic ETFs, many of the older index-based products still charge expense ratios well above 0.65% per year. Once fees reach those levels, the cost difference between passive and active management becomes much smaller. At that point, active managers gain an important advantage: flexibility.
Index-based thematic ETFs must follow predefined rules, often requiring companies to generate a minimum percentage of revenue from a particular technology, meet patent thresholds, or satisfy other rigid screening criteria. While those rules improve transparency, they also narrow the investable universe and delay exposure to emerging opportunities until a company officially qualifies for index inclusion.
Active managers, by contrast, can adapt as themes evolve. They have the discretion to initiate or exit positions without waiting for an index rebalance or methodology change. That flexibility does not guarantee outperformance, and active managers can certainly make poor decisions. However, it does allow them to respond more quickly when technological innovation moves faster than index rules.
At least in artificial intelligence (AI), that flexibility has so far produced encouraging results. Two of the largest actively managed AI ETFs have attracted significant assets while outperforming both the S&P 500 and the Nasdaq-100 over their respective track records.
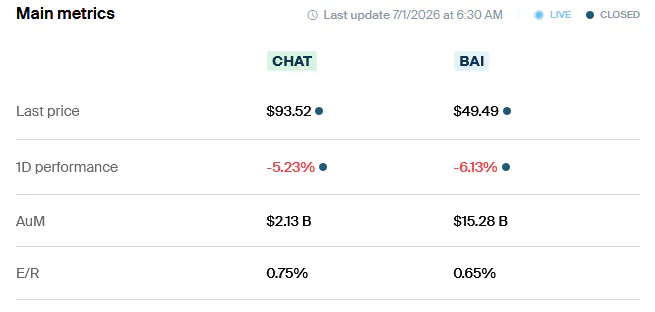
Those funds are the Roundhill Generative AI & Technology ETF (CHAT), which manages $2.13 billion in assets, and the iShares AI Innovation and Tech Active ETF (BAI), which has grown to $15.69 billion. Using data from the ETF Central comparison tool, we'll compare these two actively managed AI funds using our usual three-part framework.
Like what you're reading?
Stay in the loop — get the latest ETF insights: trends, analysis, and expert picks.
CHAT vs. BAI: Total Cost of Ownership
On headline expense ratios alone, neither ETF could be described as inexpensive. However, BAI does hold a modest advantage, charging a 0.65% expense ratio compared with 0.75% for CHAT. On a $10,000 investment, that translates to approximately $65 in annual management fees instead of $75.
Management fees, however, are only one component of an ETF's total cost of ownership. Investors also incur trading costs, most notably through the bid-ask spread. This is important for investors who trade frequently or build positions over multiple transactions. Here again, BAI again comes out ahead. The fund exhibits a narrower 30-day median bid-ask spread of 0.129%, compared with 0.160% for CHAT.
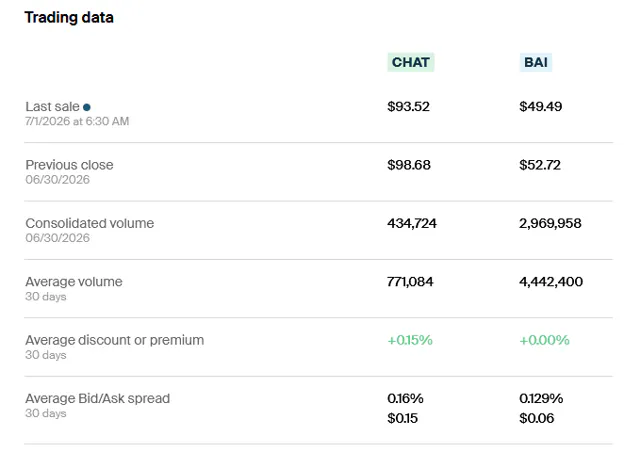
Verdict: After accounting for both the expense ratio and trading costs, BAI is the overall lower-cost ETF to own and trade over the long run.
CHAT vs. BAI: Portfolio Methodology and Exposure
Both CHAT and BAI run relatively concentrated portfolios, each holding fewer than 50 stocks. Where they differ is in how those companies are selected. As is often the case with active ETFs, neither manager fully discloses its investment process, but enough information has been released to understand the broad framework behind each strategy.
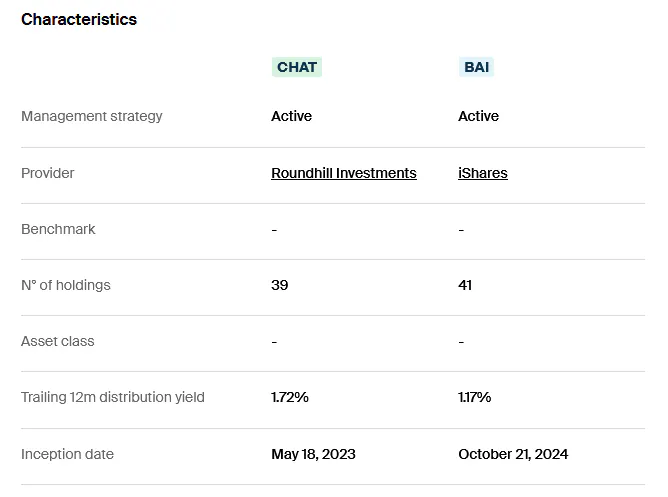
According to Roundhill CEO Dave Mazza, CHAT begins with an in-house methodology built around a "transcript score.” This likely refers to analyzing earnings calls and management commentary to determine how relevant a company is to the development and commercialization of generative AI.
From there, Roundhill incorporates more traditional fundamental measures, including revenue, profitability, and R&D spending related to AI. Companies are ultimately selected and weighted according to their overall AI exposure, with adjustments made for market capitalization and liquidity.
BAI takes a different approach, although considerably less has been disclosed publicly. The fund is managed by Tony Kim, BlackRock's Head of Fundamental Equities for the Global Technology Team, alongside portfolio manager Reid Menge, a Managing Director on the same team.
According to iShares, the managers employ a bottom-up investment process. Rather than beginning with macroeconomic forecasts or broad industry trends, they start by analyzing individual companies before building the portfolio from the ground up.
BlackRock also describes its investment framework as evaluating the entire AI stack. That begins with applications and services, extends through software and intelligence layers, and ultimately rests upon the underlying infrastructure required to power artificial intelligence.
The managers assess factors such as competitive positioning, technological disruption, and emerging innovators while attempting to identify companies most likely to benefit from long-term AI adoption. Beyond those high-level principles, however, the exact process remains largely proprietary.
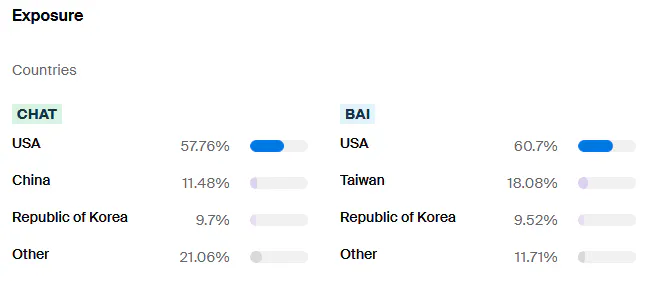
Both ETFs maintain a heavy U.S. bias, with roughly 60% of assets invested domestically. BAI allocates slightly more to the United States, while CHAT distinguishes itself with an approximately 12% allocation to Chinese companies. BAI instead directs more capital toward Taiwan, where the country accounts for roughly 18% of assets. Both funds also maintain meaningful exposure to South Korea, reflecting the country's importance within the global semiconductor supply chain.
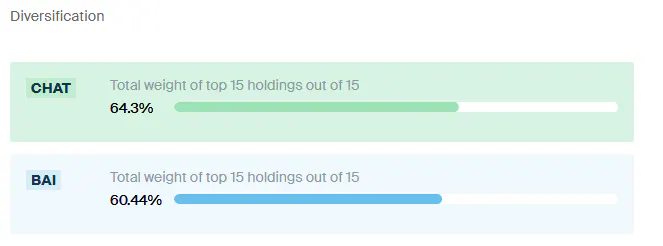
Each strategy also embraces concentration. With fewer than 50 holdings, the largest positions naturally carry significant weight. CHAT is somewhat more concentrated, with its top 15 holdings representing 64.3% of assets, compared with 60.4% for BAI.
Looking through those top holdings reveals considerable overlap. Both funds own many of the companies most closely associated with the AI investment theme, including Nvidia, Advanced Micro Devices, Micron Technology, SK Hynix, Alphabet, and Taiwan Semiconductor Manufacturing. In other words, both portfolios capture not only the hyperscale AI leaders but also important beneficiaries throughout the semiconductor supply chain, particularly memory manufacturers.
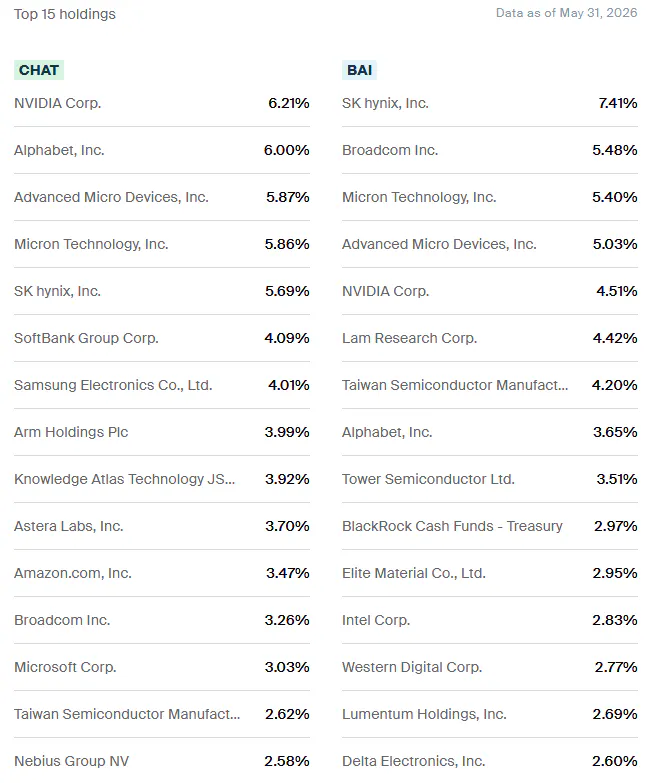
Verdict: While both funds present compelling approaches to AI investing, I think CHAT has a slight edge. So far, Roundhill has disclosed a more transparent investment framework that directly links portfolio construction to measurable AI exposure through earnings transcripts, sector relevance, and company-level fundamentals.
CHAT vs. BAI: Risk and Return
The biggest limitation of this comparison is history. CHAT launched in May 2023, while BAI did not debut until October 2024. That leaves only a relatively short period over which the two funds can be compared directly, so any conclusions should be viewed with appropriate caution. Even so, the available data provides a few useful observations.
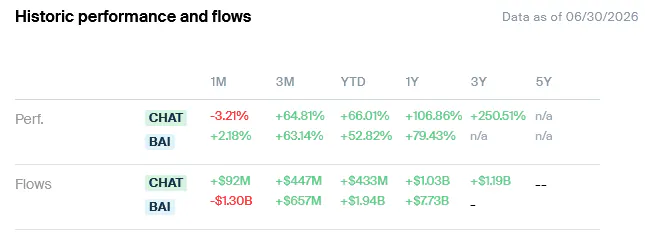
In terms of returns, CHAT has generally held the advantage. As of June 30, it outperformed BAI over the trailing one-year, year-to-date, and three-month periods. BAI did manage to outperform over the most recent one-month period, illustrating how quickly leadership can shift within a fast-moving sector like artificial intelligence.
Both funds have also attracted substantial investor inflows, reflecting continued enthusiasm for actively managed AI strategies. BAI's asset gathering has been significantly stronger, although that is hardly surprising given BlackRock's distribution network, brand recognition, and substantially larger asset base.
As expected from concentrated portfolios invested almost entirely in AI-related equities, neither fund should be considered low risk. However, CHAT has demonstrated a modest edge. Over both the trailing one-year and three-month periods, it experienced lower annualized volatility than BAI, suggesting that it has historically delivered a somewhat smoother ride despite pursuing the same investment theme.
Maximum drawdowns tell a slightly different story. Both funds have experienced declines of comparable depth, indicating that neither has been immune to periodic weakness in AI stocks. Where some separation emerges is in recovery time. Historically, CHAT has spent fewer days below its previous peak than BAI, suggesting somewhat quicker recoveries following market pullbacks.
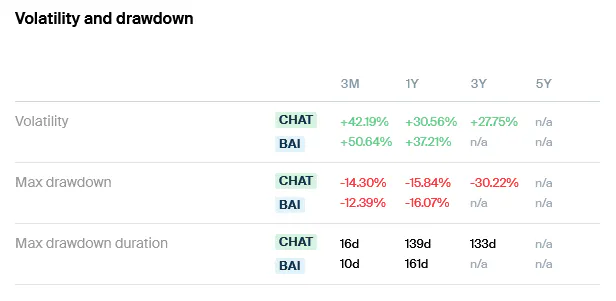
Verdict: Based on the evidence available today, CHAT receives a narrow edge. It has delivered stronger returns while exhibiting somewhat lower volatility and shorter recovery periods following drawdowns. The sample size remains small, however, so this should be viewed as an early observation rather than a definitive conclusion. As both funds establish longer track records, it will become much easier to determine whether these differences represent manager skill or simply short-term market dynamics.
Please note this article is for information purposes only and does not in any way constitute investment advice. It is essential that you seek advice from a registered financial professional prior to making any investment decision.
Mentioned ETFs
Further reading

Latest ETF News
See all ETF newsThere's an ETF for That? Humanoid Robotics and Physical AI

How Some ETF Issuers Use Their Own Funds for Cash Management

These Public-Private ETFs Invest in Polymarket and Anduril

There's an ETF for That? Frontier Markets




 Advantages of ETFs over Mutual Funds1/6
Lower Costs
In this guide, we'll explore the advantages of ETFs over mutual funds, giving you valuable insights into why ETFs have gained significant popularity among investors like yourself.
Leveraged ETFs: Unlocking the Potential for Amplified Returns1/6
Understanding Leveraged ETFs
Explore leveraged ETFs: potential for amplified returns & risks. 5 ETFs to consider across equities, commodities & fixed income.
What is a Leveraged ETF?1/6
Introducing Leveraged and Inverse ETFs
In this guide, we'll dive into the world of leveraged ETFs, exploring their definition, mechanics, potential risks, and rewards.
Recent educational content

ETF Trends
ETF Industry KPIs October 5, 2026
This week’s KPI data overview highlights key metrics and trends shaping the ETF landscape.

ETF Trends
ETF Industry KPIs September 28, 2026
This week’s KPI data overview highlights key metrics and trends shaping the ETF landscape.
ETF Trends
ETF Industry KPIs September 22, 2026
This week’s KPI data overview highlights key metrics and trends shaping the ETF landscape.
First Look ETF
First Look ETF: Income, Corporate Arbitrage, and Growth and Value Investing
First Look ETF September 2026: iCapital, Mast Investments and North Square unpack new ETFs targeting monthly income, merger arbitrage and complementary growth and value exposure.

Browse all educational columns



ETFs’ Next Act: From Access to Selection
With 1,790 new products launched by July 2026, choosing is harder than ever. Our Global ETF Survey 2026, built on 620 professional investors and allocators, shows how active, fixed income, options-based and thematic ETFs are reshaping fund selection.