Open Now: The Global ETF Survey Take the Survey →

ETF Industry KPIs 6/29/2026
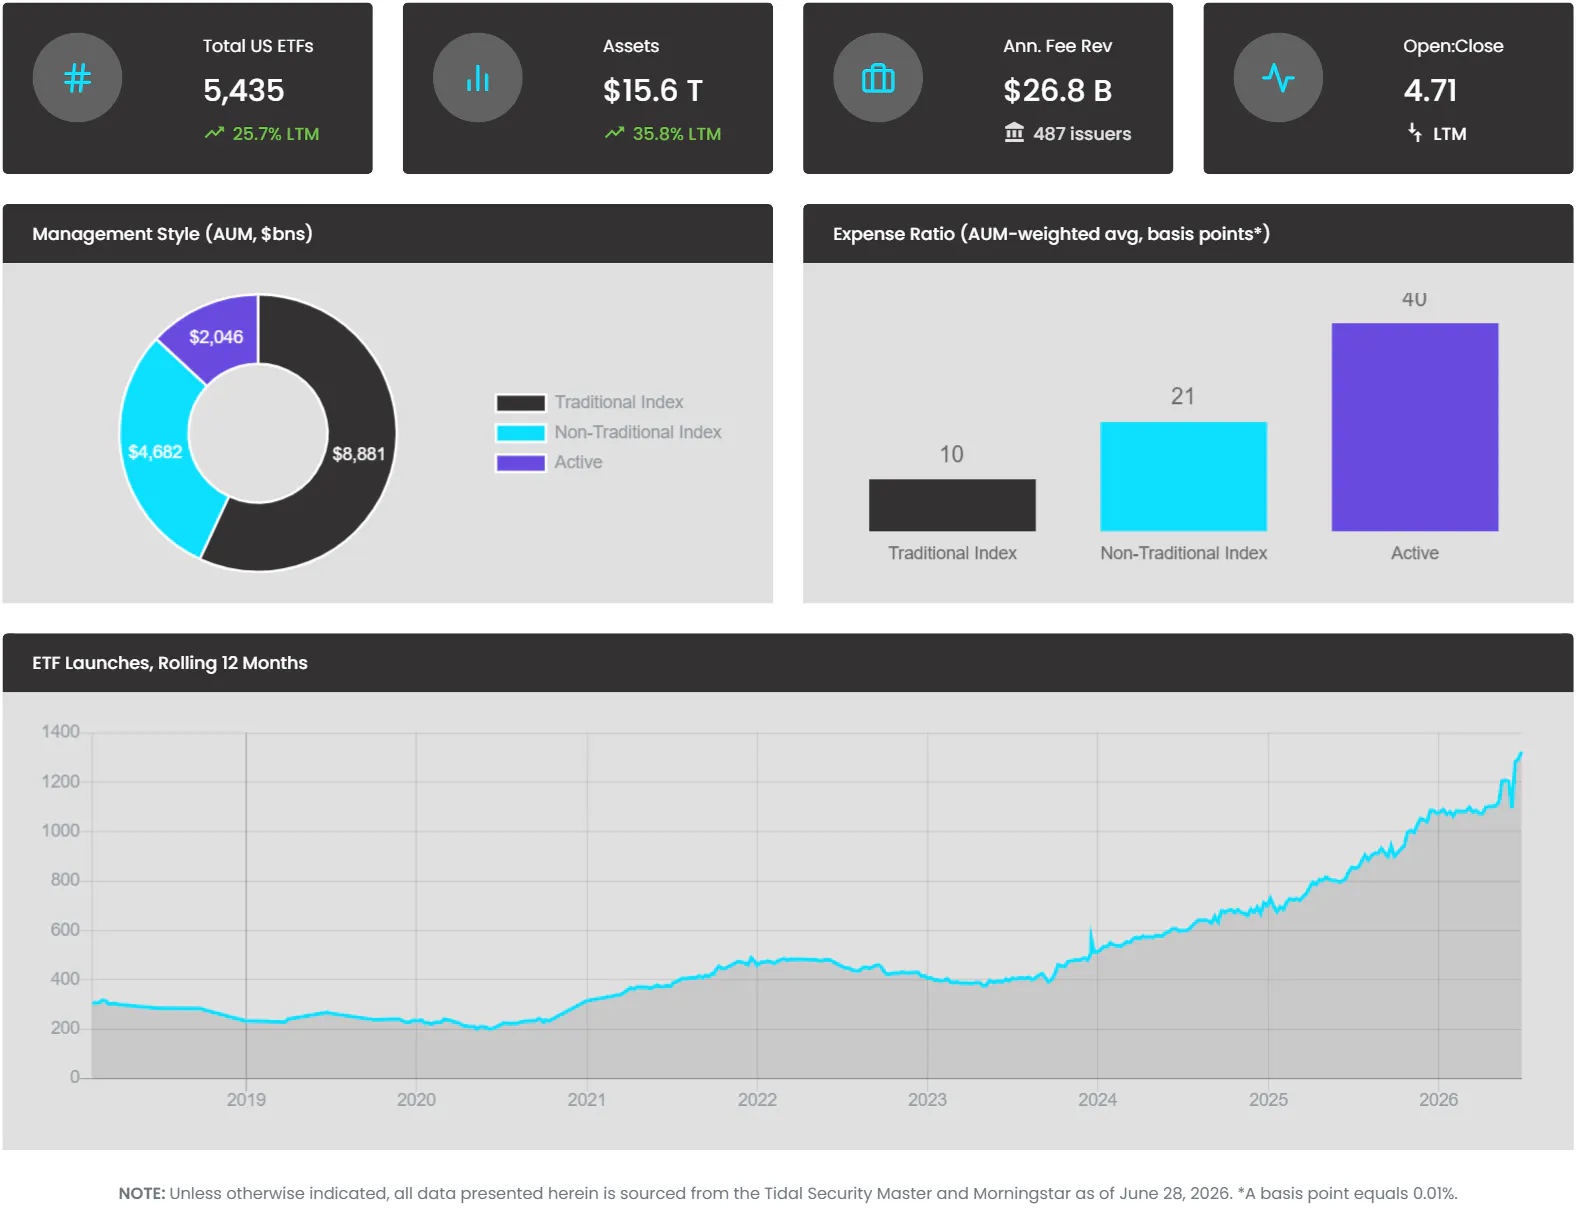
This week’s KPI data overview highlights key metrics and trends shaping the ETF landscape:

There were 69 additions to the ETF universe last week and 2 closures, bringing the total U.S.-listed ETF count to 5,435, up 25.7% over the past year.
AUM is up 35.8% to $15.6 trillion over the past 12 months.
The ETF Industry Is Evolving Fast
From AI infrastructure to active strategies, the ETF landscape is shifting. Share your perspective in the 7th Annual Global ETF Survey and get exclusive early access to the final report.
Estimated Annual Fee Revenue for the industry (based on funds’ current AUM and expense ratios) hit another all-time high of $26.8 billion.
There are now 487 issuers by our count, up three over the past week.
Disclaimer
This material is for informational purposes only and does not constitute an offer to sell or a solicitation of an offer to buy any security. It should not be relied upon as investment advice, and it does not consider the investment objectives, financial situation, or particular needs of any individual investor. Investors should consult a financial professional before making any investment decisions.
Past performance is not indicative of future results, and there is no guarantee that concentrated strategies will outperform more diversified approaches. References to specific ETFs and providers are for illustrative purposes only and do not constitute an endorsement or recommendation.
The Tidal Diversification Calculator is a proprietary tool intended solely to help investors understand ETF diversification levels. It should not be construed as a recommendation to buy, sell, or hold any particular ETF. Any analysis provided (e.g., comparing SPY and RSP) is based solely on diversification metrics and does not imply suitability for any investor. Differences in returns, liquidity, expenses, and other factors should be considered before making any investment decision.
All investments involve risk, including the possible loss of principal. There is no guarantee that any investment strategy will be successful.
Segments
See all
No specific market segments were tagged
Mentioned ETFs
No specific ETFs were tagged
Further reading


Latest publications
See allETF Industry KPIs June 22, 2026

ETF Industry KPIs June 1, 2026
ETF Industry KPIs May 20, 2026
ETF Industry KPIs May 11, 2026
ETF Industry KPIs May 5, 2026
ETF Industry KPIs April 27, 2026
ETF Industry KPIs April 20, 2026
ETF Industry KPIs March 30, 2026
ETF Industry KPIs March 23, 2026

Active Trader Report: Use of Leveraged & Inverse ETFs Way Up
Direxion partnered with Compound Insights and Vanda to explore what’s driving the evolution of active trading — and how active traders are using leveraged and inverse funds across equities, single stocks, commodities, and volatility.
