Global ETF Survey Is Live! 600+ ETF Professionals Weigh In. See Results →



ETF Comparison: NEOS Russell 2000 High Income ETF (IWMI) Versus Global X Russell 2000 Covered Call ETF (RYLD)
Covered call ETFs targeting small-cap stocks can deliver high monthly income potential, but investors need to pick carefully between active versus systematic implementation.

Keep up with what matters in ETFs
Get timely ETF insights, market trends, and top ideas straight to your inbox.
Your newsletter subscriptions with us are subject to ETF Central's Privacy Policy and Terms and Conditions.
It's fairly common knowledge that small-cap stocks tend to be more volatile than their large-cap counterparts. Smaller companies generally have less diversified revenue streams, thinner profit margins, weaker balance sheets and greater sensitivity to economic conditions and borrowing costs. Their shares can also be less liquid, magnifying price moves when investor sentiment changes.
You can see the difference by comparing two broad-market ETFs. According to iShares, the iShares Russell 2000 ETF
For option sellers, however, volatility has an important upside. All else being equal, higher implied volatility translates into higher option premiums because greater uncertainty increases the probability and potential magnitude of future price movements. Buyers are therefore willing to pay more for the optionality, and sellers demand greater compensation for assuming the corresponding risk.
That can make the Russell 2000 particularly interesting for covered call strategies. An ETF can maintain exposure to small-cap stocks while repeatedly selling calls against that exposure, converting some of the index's elevated implied volatility into option premium and, ultimately, monthly distributions. The trade-off is the familiar one with covered calls: stronger rallies can leave the strategy lagging the underlying index as the calls limit some of its upside.
Unsurprisingly, several issuers now compete in this corner of the market. Two of the largest are the NEOS Russell 2000 High Income ETF
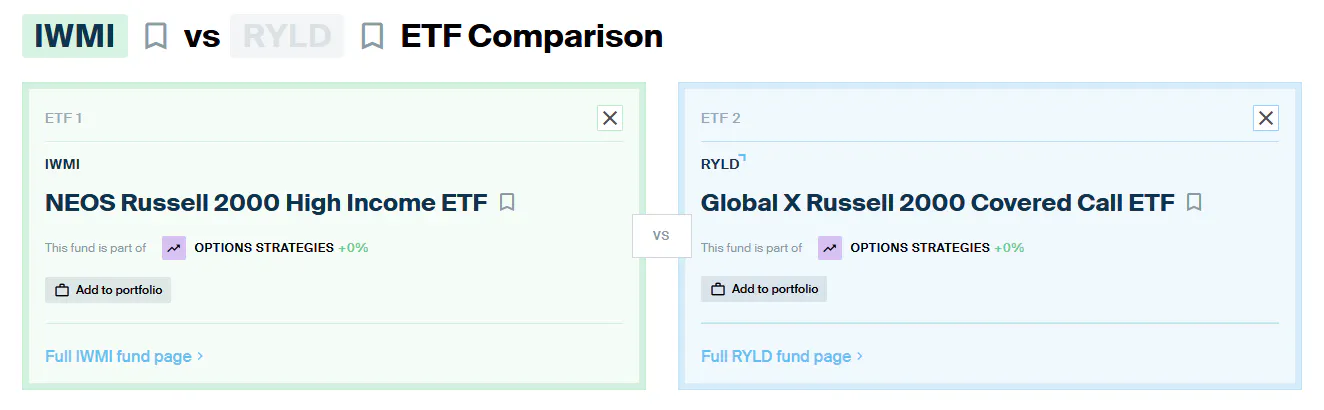
Both are small-cap buy-write strategies built around the Russell 2000, but they implement their options overlays quite differently. Here's how IWMI and RYLD fare head-to-head based on data from ETF Central's comparison tool across our three usual categories.
Like what you're reading?
Stay in the loop — get the latest ETF insights: trends, analysis, and expert picks.
IWMI Versus RYLD: Total Cost of Ownership
One thing I've noticed in the derivative income ETF space is that passive, index-based option strategies can sometimes charge nearly as much as their actively managed counterparts. Part of the reason is that the specialized indexes required to run these strategies can be more expensive to license than conventional benchmarks.
RYLD charges a 0.60% expense ratio, while IWMI comes in at 0.76%. Of IWMI's total cost, 0.68% consists of management fees and another 0.08% comes from acquired fund fees and expenses. On headline expense ratios alone, RYLD has the advantage.
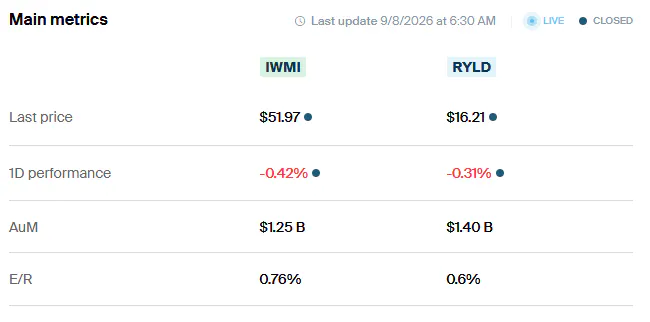
Covered call ETFs are generally suited to a buy-and-hold approach, so trading costs shouldn't matter as much as recurring management expenses. Still, bid-ask spreads are worth considering. On a 30-day average basis, IWMI has the tighter spread at 0.047%, compared with 0.068% for RYLD. Both are sufficiently liquid that I wouldn't consider the difference especially consequential.
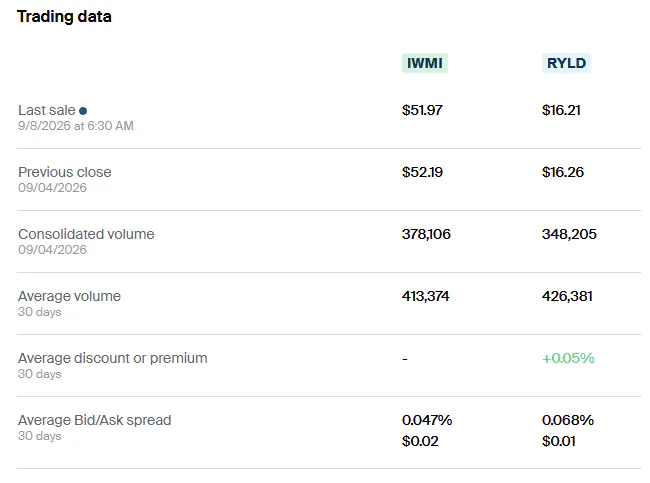
Verdict: Adding the expense ratio and 30-day average bid-ask spread gives an indicative first-year cost of approximately 0.807% for IWMI versus 0.668% for RYLD. That isn't a perfect measure of long-term ownership costs since the spread is generally incurred when trading rather than annually, but it illustrates the size of RYLD's fee advantage.
IWMI Versus RYLD: Methodology and Exposure
We're not going to spend much time comparing sector or individual stock exposure here. Both ETFs are built around the Russell 2000, so investors looking for a deeper understanding of their underlying equity exposure should start with the benchmark itself. I'm more interested in how each ETF monetizes Russell 2000 volatility, because that's where IWMI and RYLD differ considerably.
IWMI is actively managed, while RYLD follows a systematic index strategy. On a trailing 12-month basis, IWMI currently has the higher distribution yield at 13.88%, versus 11.53% for RYLD. As always, though, total return matters more than the headline yield, which we'll examine in the next comparison.
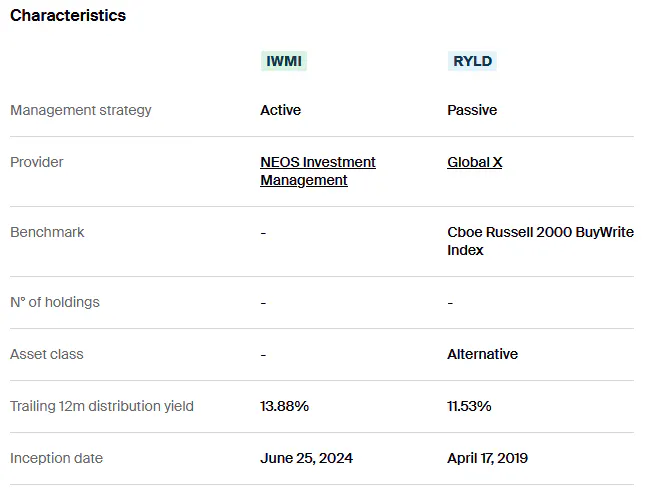
Let's start with RYLD. The ETF tracks the Cboe Russell 2000 BuyWrite Index, which follows a rules-based covered call strategy. Each month, the index sells at-the-money Russell 2000 call options against 100% of its equity exposure. "At the money" means the option's strike price is approximately equal to the index's current level, while the 100% overwrite means calls are effectively written against the entire portfolio.
That's an aggressive way to generate option premium, but it also places a substantial ceiling on upside participation. RYLD distributes half of the option premium received, subject to a monthly cap of 1% of net asset value (NAV), with the remainder reinvested into the fund. The process is systematic, repeating each month regardless of prevailing market conditions.
IWMI takes a much more dynamic approach. It maintains exposure to the Russell 2000 stocks while actively managing its index options overlay. The managers can adjust how much of the portfolio is overwritten, where strike prices are set, and their expiration dates depending on market conditions.
IWMI can also purchase call options alongside the calls it sells, creating call spreads. This can allow the strategy to regain some upside participation if the Russell 2000 rises sufficiently beyond the purchased call's strike. That's an important distinction from RYLD's systematic at-the-money, 100% overwrite, which can heavily constrain returns during strong small-cap rallies.
Tax efficiency is one area where both strategies currently look similar. According to their latest Section 19a-1 notices for August, both ETFs estimated that 100% of their monthly distributions consisted of return of capital. Return of capital generally isn't immediately taxable. Instead, it reduces an investor's adjusted cost basis, deferring the tax liability until the shares are eventually sold. Those classifications are only estimates during the year, however, with the final tax treatment determined on Form 1099-DIV.
Verdict: IWMI. RYLD offers a transparent and predictable buy-write methodology, but I prefer IWMI's flexibility. The ability to vary overwrite ratios, strikes and expirations, while also using call spreads to potentially restore some upside participation, gives its managers more tools.
IWMI Versus RYLD: Risk and Return
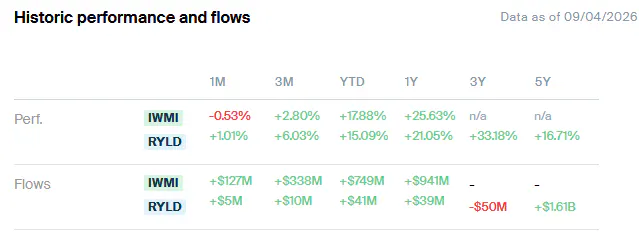
Over their common lifespan, IWMI has delivered the stronger total return. It has outperformed RYLD over both the trailing one-year and year-to-date periods, although RYLD has pulled ahead over the most recent three months. IWMI has also attracted substantially greater net inflows, suggesting investors have increasingly favored its more active approach to harvesting Russell 2000 volatility.
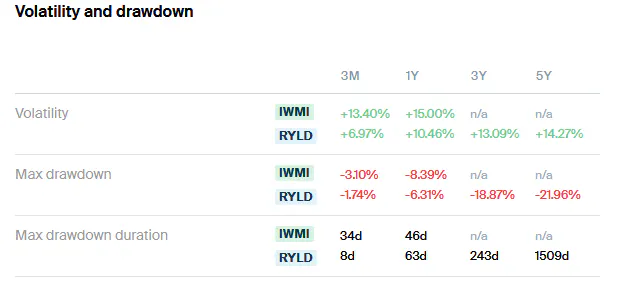
The tradeoff shows up on the risk side. IWMI has experienced higher volatility and a larger maximum drawdown than RYLD, albeit with a quicker recovery. Some of that can be traced directly to the differences in their options overlays.
RYLD's systematic sale of at-the-money calls against 100% of its portfolio collects substantial option premium while surrendering most near-term upside beyond the strike price. That structure can be particularly effective when the Russell 2000 trades sideways or declines moderately, since the premium collected provides a larger cushion against losses.
IWMI’s managers can reduce the overwrite ratio, select different strikes and use call spreads that reopen some upside if the Russell 2000 rallies sufficiently far. Those features can help total returns during stronger small-cap markets, but they also mean IWMI doesn't always collect as much option premium or maintain as much of a buffer against declines as RYLD.
Verdict: IWMI. Total return remains the more important metric, and IWMI has come out ahead over the longer periods available for comparison. Its active mandate also makes sense in a volatile asset class like small caps, where the attractiveness of selling options can change substantially with volatility, valuations and market direction.
Please note that this article reflects the author’s personal views and does not represent the opinions of the publication or its affiliates. It is for informational purposes only and does not constitute investment advice. It is essential to seek guidance from a registered financial professional before making any investment decisions.
Segments
See all
Mentioned ETFs
Further reading
Latest ETF News
See all ETF newsETF Comparison: Vanguard Total World Stock ETF (VT) Versus Dimensional World Equity ETF (DFAW)

ETF Comparison: NEOS Nasdaq-100 High Income ETF (QQQI) Versus Goldman Sachs Nasdaq-100 Premium Income ETF (GPIQ)




 Advantages of ETFs over Mutual Funds1/6
Lower Costs
In this guide, we'll explore the advantages of ETFs over mutual funds, giving you valuable insights into why ETFs have gained significant popularity among investors like yourself.
Leveraged ETFs: Unlocking the Potential for Amplified Returns1/6
Understanding Leveraged ETFs
Explore leveraged ETFs: potential for amplified returns & risks. 5 ETFs to consider across equities, commodities & fixed income.
What is a Leveraged ETF?1/6
Introducing Leveraged and Inverse ETFs
In this guide, we'll dive into the world of leveraged ETFs, exploring their definition, mechanics, potential risks, and rewards.
Recent educational content

ETF Trends
ETF Industry KPIs November 9, 2026
This week’s KPI data overview highlights key metrics and trends shaping the ETF landscape.

ETF Trends
ETF Industry KPIs November 3, 2026
This week’s KPI data overview highlights key metrics and trends shaping the ETF landscape.

First Look ETF
First Look ETF: Income, International, and Cash Flow ETFs
In this season 6 episode of First Look ETF, Stephanie Stanton @etfguide examines the latest ETF marketplace trends with NYSE and guests.

ETF Trends
ETF Industry KPIs October 5, 2026
This week’s KPI data overview highlights key metrics and trends shaping the ETF landscape.