ETF model portfolios designed for real investor needs. Discover →



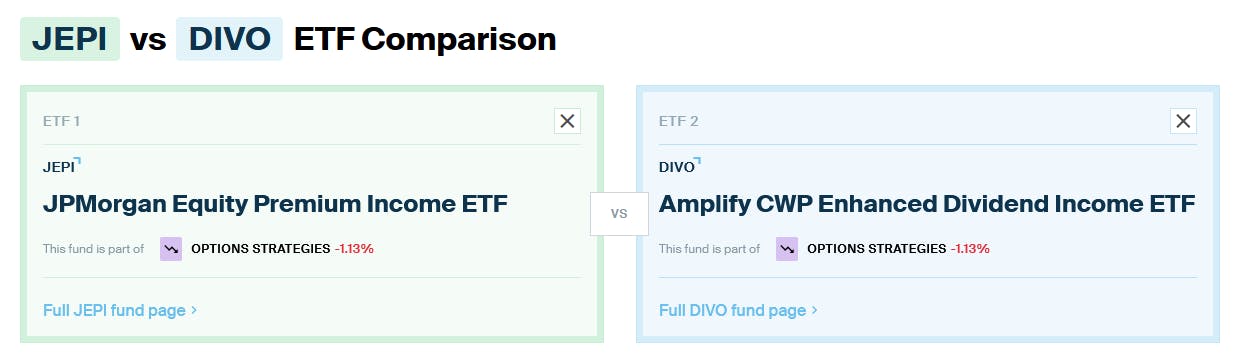
ETF Comparison: JPMorgan Equity Premium Income ETF (JEPI) Versus Amplify CWP Enhanced Dividend Income ETF (DIVO)
Two of the top actively managed derivative income ETFs go head-to-head in this week's ETF comparison.

Keep up with what matters in ETFs
Get timely ETF insights, market trends, and top ideas straight to your inbox.
Your newsletter subscriptions with us are subject to ETF Central's Privacy Policy and Terms and Conditions.
In 2022, during a challenging bear market, derivative income ETFs, particularly those using covered call strategies, gained popularity for their resilience compared to long-only equity funds.
Among these, the JPMorgan Equity Premium Income ETF
Here's a head-to-head comparison of these two ETFs, leveraging data from ETF Central's comparison tool to see which might offer better value for investors looking for derivative income strategies.
Global ETF Survey 2026 is Live!
With 1,790 new products launched by July 2026, choosing is harder than ever. Our Global ETF Survey 2026, built on 620 professional investors and allocators, shows how active, fixed income, options-based and thematic ETFs are reshaping fund selection.
JEPI vs DIVO: Total cost of ownership
JEPI
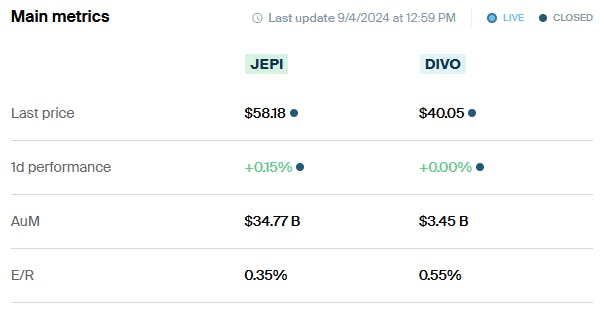
Interestingly, JEPI's expense ratio matches that of some popular dividend index ETFs like the ProShares S&P 500 Dividend Aristocrats ETF
When considering trading costs, JEPI continues to lead with a 30-day median average bid-ask spread of 0.024%, significantly lower than DIVO's 0.176%. This makes JEPI not only cheaper to hold over the long term but also more cost-effective to trade.
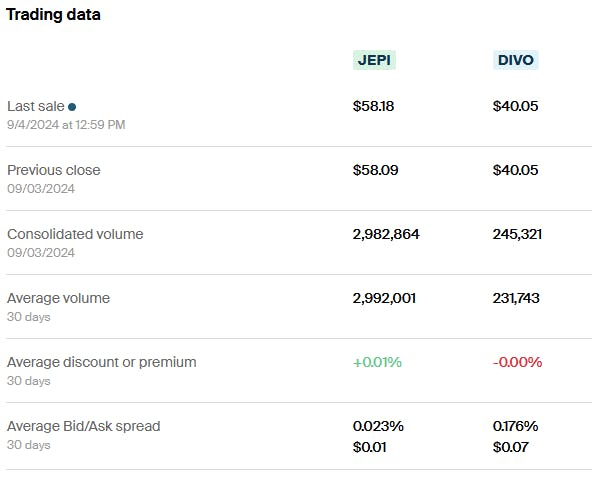
Overall, JEPI presents a more affordable choice for investors looking at both upfront and ongoing costs. It is one of the cheapest actively managed derivative income ETFs on the market today.
JEPI vs DIVO: Methodology and holdings
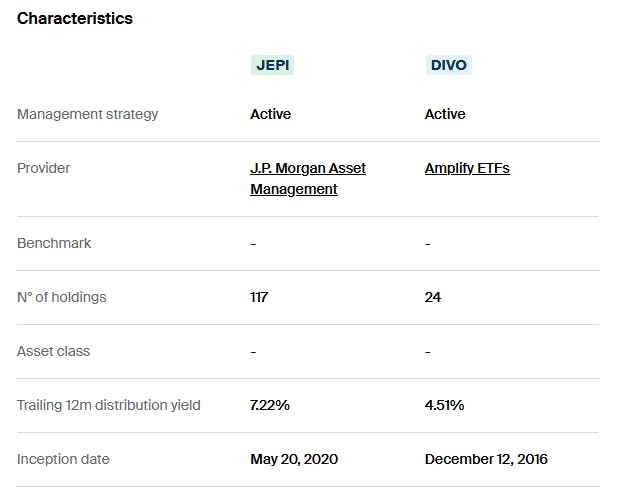
Both JEPI and DIVO employ unique active management strategies not tied to a specific index, pairing equity holdings with an income-enhancing covered call strategy.
JEPI
To boost its income, JEPI utilizes a portion of its assets to sell out-of-the-money covered call options on the S&P 500 index through equity-linked notes (ELNs), enhancing the yield which currently stands at 7.22% over the trailing 12 months.
DIVO
Unlike JEPI, DIVO actively sells covered call options directly on its individual holdings rather than on an index, aligning more closely with its tactical management style. This strategy supports a trailing 12-month yield of 4.51%, although it tends to fluctuate.
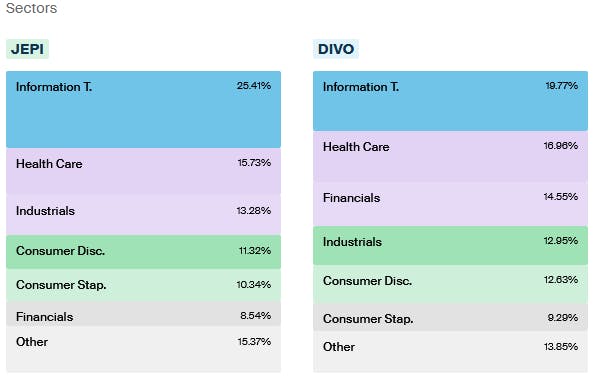
In terms of portfolio composition, JEPI aligns more closely with the broader market of the S&P 500 but focuses on lower-volatility selections within each sector.
On the other hand, DIVO's sector allocation is more tactical, with management having the flexibility to overweight or underweight sectors based on their strategic views, currently favoring technology and healthcare.
Significantly, JEPI is less top-heavy compared to DIVO, with its top 15 holdings making up 25.87% of the portfolio, whereas DIVO's top 15 constitute a hefty 77.37% of its assets.
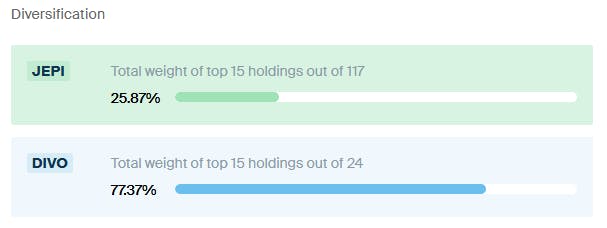
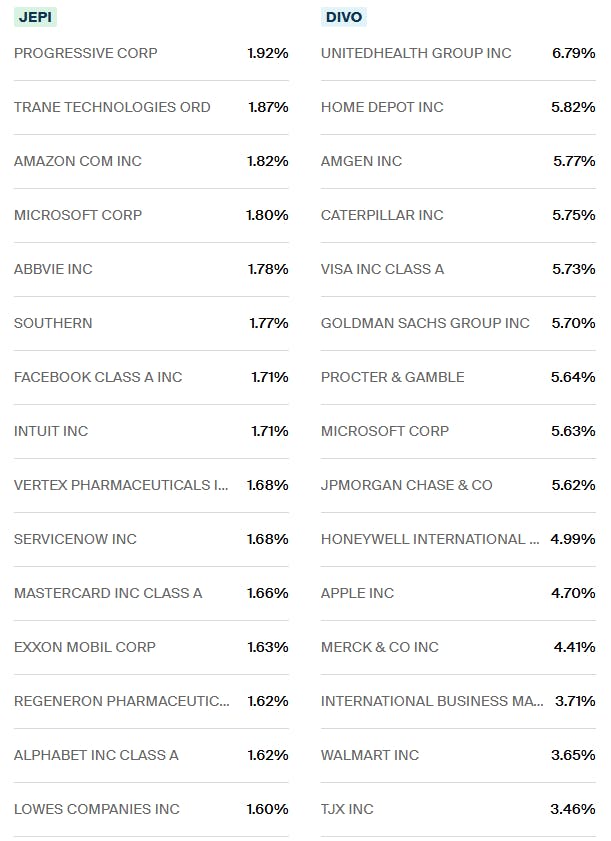
This highlights DIVO's more concentrated and high-conviction approach to stock selection and option strategy, in contrast to JEPI's broader, index-like coverage and focus on mirroring the market with less volatility.
JEPI vs DIVO: Risk and return
Over the past three years and one year, DIVO
JEPI
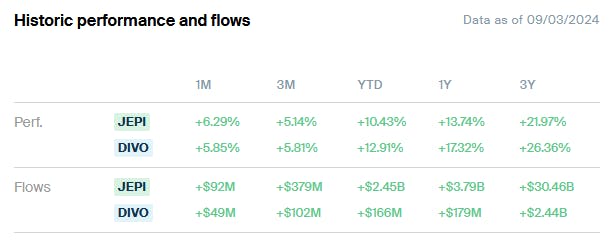
From May 2020 to the present, despite JEPI having a higher distribution yield, DIVO has delivered superior total returns for the reasons mentioned.
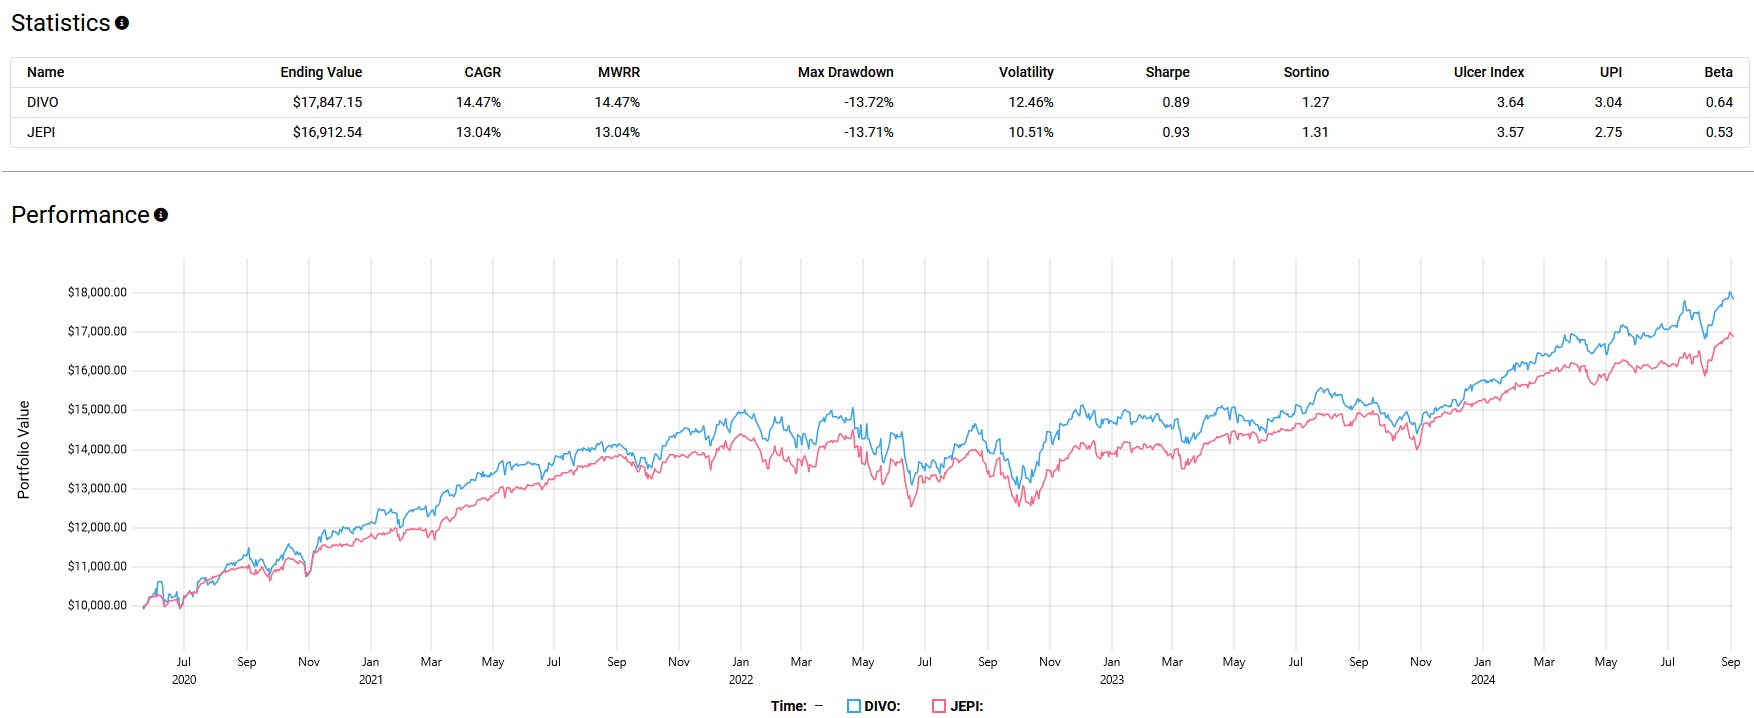
However, it's worth noting that JEPI achieved its goal of lower volatility, evidenced by a better Sharpe ratio of 0.92 compared to DIVO's 0.89, indicating better risk-adjusted returns and a lower standard deviation.
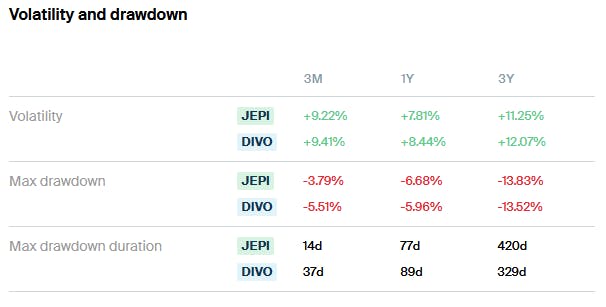
Which is better? For beginner income investors, JEPI might be the more appealing choice—it's cheaper, has a broader portfolio, exhibits lower volatility, and employs a more systematic options selling strategy which adds predictability.
For those seeking active management, DIVO's concentrated portfolio and tactical call writing stand out. Both ETFs generate above-average income, but JEPI pulls ahead with higher income at the cost of slightly lower total returns.
Please note this article is for information purposes only and does not in any way constitute investment advice. It is essential that you seek advice from a registered financial professional prior to making any investment decision.
Segments
See all
Mentioned ETFs
Further reading
Latest ETF News
See all ETF newsThere's an ETF for That? Humanoid Robotics and Physical AI

How Some ETF Issuers Use Their Own Funds for Cash Management

These Public-Private ETFs Invest in Polymarket and Anduril

There's an ETF for That? Frontier Markets




 Advantages of ETFs over Mutual Funds1/6
Lower Costs
In this guide, we'll explore the advantages of ETFs over mutual funds, giving you valuable insights into why ETFs have gained significant popularity among investors like yourself.
Leveraged ETFs: Unlocking the Potential for Amplified Returns1/6
Understanding Leveraged ETFs
Explore leveraged ETFs: potential for amplified returns & risks. 5 ETFs to consider across equities, commodities & fixed income.
What is a Leveraged ETF?1/6
Introducing Leveraged and Inverse ETFs
In this guide, we'll dive into the world of leveraged ETFs, exploring their definition, mechanics, potential risks, and rewards.
Recent educational content

First Look ETF
First Look ETF: Income, International, and Cash Flow ETFs
In this season 6 episode of First Look ETF, Stephanie Stanton @etfguide examines the latest ETF marketplace trends with NYSE and guests.


ETF Trends
ETF Industry KPIs October 5, 2026
This week’s KPI data overview highlights key metrics and trends shaping the ETF landscape.

ETF Trends
ETF Industry KPIs September 28, 2026
This week’s KPI data overview highlights key metrics and trends shaping the ETF landscape.
ETF Trends
ETF Industry KPIs September 22, 2026
This week’s KPI data overview highlights key metrics and trends shaping the ETF landscape.
Browse all educational columns



ETFs’ Next Act: From Access to Selection
With 1,790 new products launched by July 2026, choosing is harder than ever. Our Global ETF Survey 2026, built on 620 professional investors and allocators, shows how active, fixed income, options-based and thematic ETFs are reshaping fund selection.