Open Now: The Global ETF Survey Take the Survey →

ETF Comparison: Global X Silver Miners ETF (SIL) Versus Amplify Junior Silver Miners ETF (SILJ)
Both ETFs deliver exposure to silver mining equities, but with different levels of risk.


Keep up with what matters in ETFs
Get timely ETF insights, market trends, and top ideas straight to your inbox.
Your newsletter subscriptions with us are subject to ETF Central's Privacy Policy and Terms and Conditions.
After years of false starts, the silver-to-gold ratio has finally begun moving in a direction silver bulls have been waiting for. The second-largest precious metal is starting to follow gold’s lead as the debasement trade continues and concerns around the U.S. dollar persist amid rising geopolitical tension, both within the United States and globally.
That is only part of the story. Silver also benefits from long-term industrial demand. It is a critical input in electronics, solar panels, batteries, and electrical infrastructure. Much of the focus here remains on China, where continued investment in solar capacity, power grids, and manufacturing keeps silver demand structurally supported.
While spot silver ETFs remain the simplest way to gain exposure, more aggressive investors often turn to silver mining ETFs for embedded leverage. As with gold miners, silver miners tend to have relatively fixed operating costs. When silver prices rise sharply, revenues increase immediately while costs lag, leading to margin expansion, higher earnings, and amplified equity returns.
For investors looking to express that view, two ETFs dominate the conversation. The first is the Global X Silver Miners ETF
The ETF Industry Is Evolving Fast
From AI infrastructure to active strategies, the ETF landscape is shifting. Share your perspective in the 7th Annual Global ETF Survey and get exclusive early access to the final report.
SIL versus SILJ: Total Cost of Ownership
One rule worth repeating is that the more specific an ETF becomes, the more it tends to cost. Sector ETFs are pricier than broad market funds, industry ETFs are pricier than sector funds, and thematic products usually cost more still. Silver miners sit firmly in the industry category.
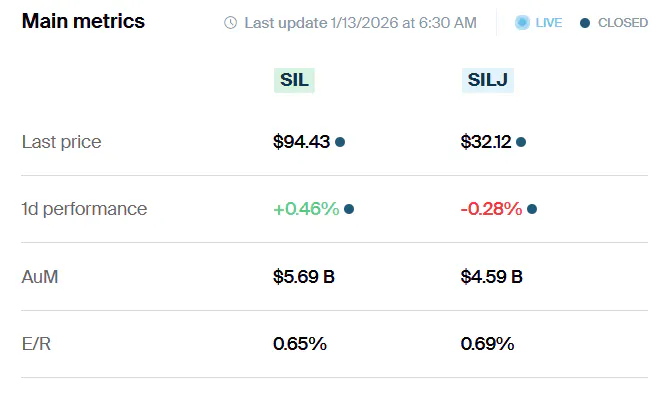
Neither of these ETFs is cheap. SIL charges a 0.65% expense ratio, while SILJ comes in slightly higher at 0.69%. On a $10,000 investment, that translates to an annual fee drag of $65 versus $69. For long-term investors, the expense ratio is the primary cost to consider.
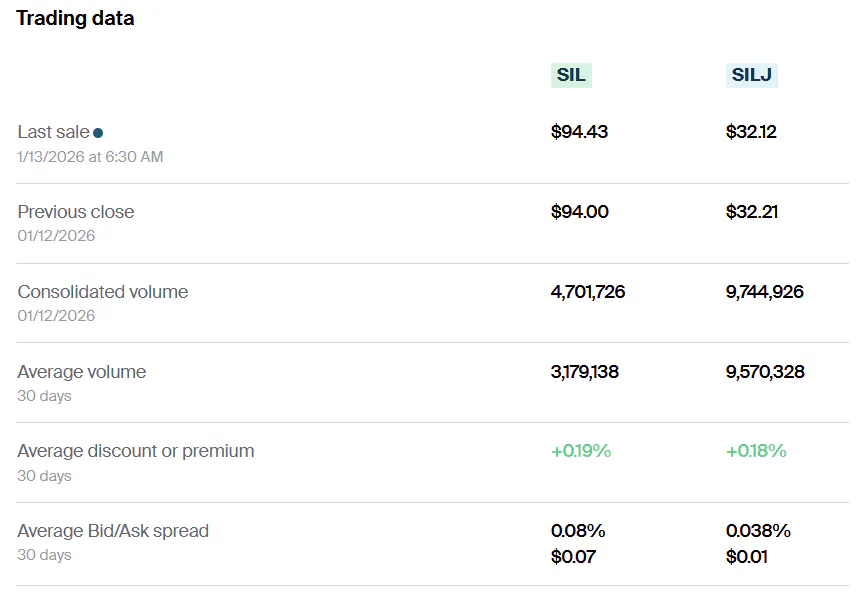
Short-term traders also need to account for bid-ask spreads. Here, SILJ is surprisingly more liquid. SIL has a 30-day average bid-ask spread of 0.08%, while SILJ is notably tighter at 0.038%.
Verdict: When expense ratios and trading costs are considered together, the result is effectively a draw. SIL is marginally cheaper for long-term holders, while SILJ is cheaper to trade over shorter time horizons.
SIL versus SILJ: Methodology and Exposure
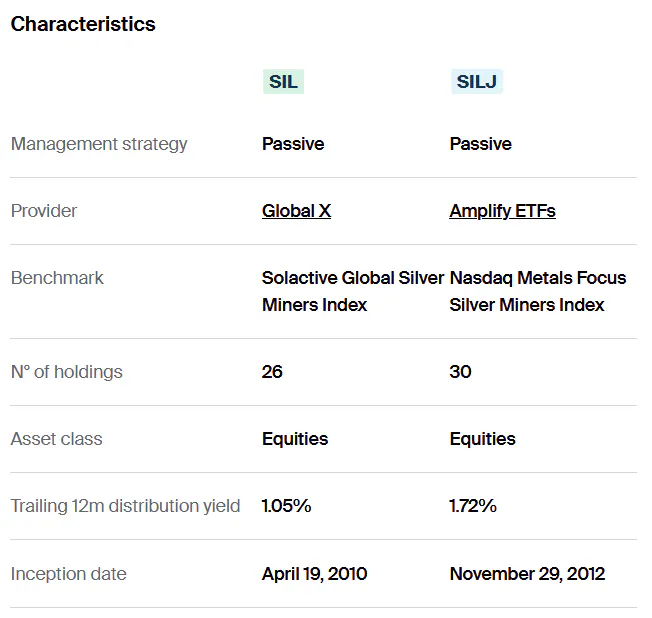
Both ETFs are passive and track index benchmarks, but the similarities largely end there. While there is some overlap between their baskets, investors need to be careful when selecting.
SIL tracks the Selective Global Silver Miners Index. The fund holds 26 companies, overwhelmingly in the materials sector. Many holdings are not pure-play silver miners and often have meaningful gold exposure as well, which can dilute sensitivity to silver prices.
SILJ tracks the Nasdaq Metals Focus Silver Miners Index. While a portion of the portfolio still consists of firms with market capitalizations above $10 billion, more than half of the fund sits in the mid-cap range between $2 billion and $10 billion. About 15.27% of the portfolio falls between $300 million and $2 billion, adding a clear speculative tilt.
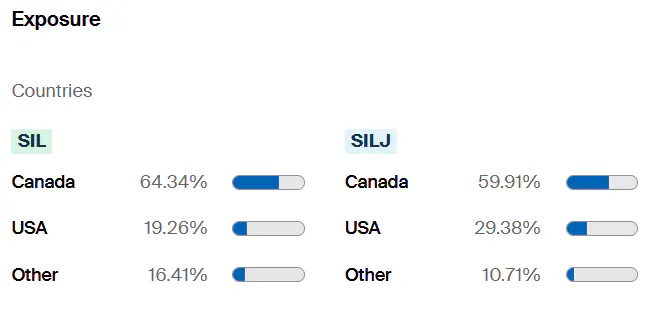
Geographically, both ETFs are heavily weighted toward Canada, which reflects the country’s role as a global hub for precious metals mining. Canada offers relatively stable political and regulatory conditions, making expropriation or nationalization far less likely than in many emerging markets. Both ETFs also maintain meaningful U.S. exposure.
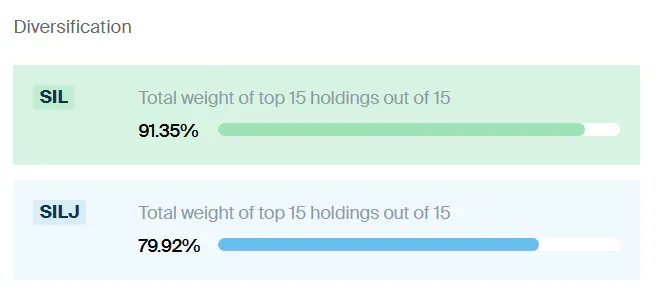
Neither fund is particularly diversified. In SIL, the top 15 holdings account for 91.35% of the portfolio. SILJ is slightly less concentrated, with the top 15 making up 79.92%, but both are best viewed as satellite allocations rather than core holdings.
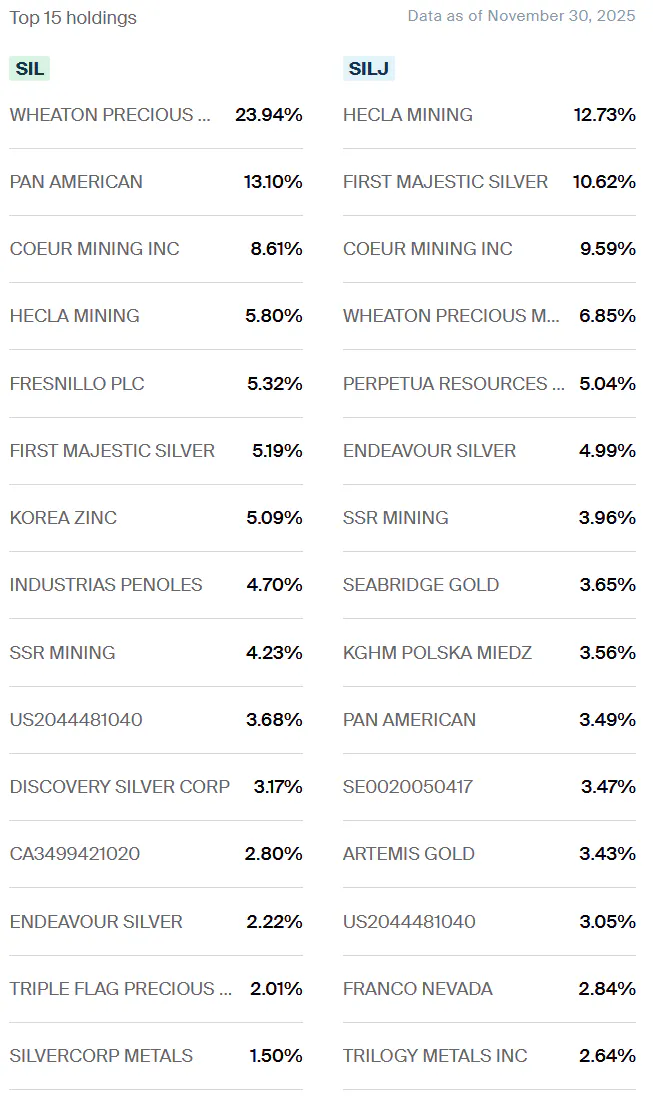
The composition of top holdings highlights the difference in approach. SIL is closer to a buy-the-industry option, with larger allocations to established companies. Wheaton Precious Metals alone represents 23.94% of the fund. While Wheaton is a streamer rather than a traditional miner, it remains closely tied to silver prices through its royalty structure.
SILJ, by contrast, leans heavily into mid-cap producers such as Hecla Mining and First Majestic Silver, with a long tail of smaller, higher-risk names. These companies offer greater upside in strong silver markets but come with more operational and financing risk.
Verdict: SIL provides broad exposure across the silver mining industry, balancing scale and stability. SILJ adds more leverage through smaller and less established miners. That leverage can enhance returns in bull markets and deepen losses in bear markets. Personally, I think SIL is the better “all around” option.
SIL versus SILJ: Risk and Return
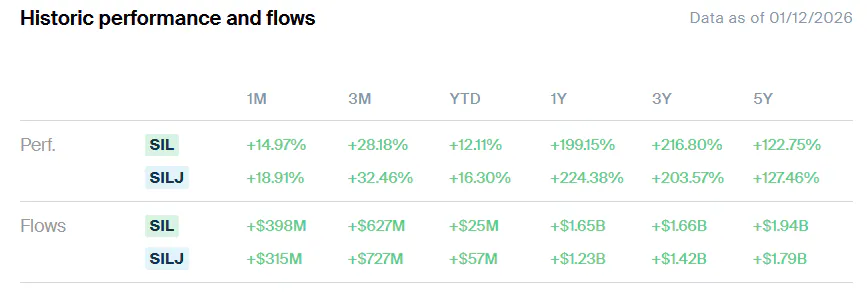
Performance for both ETFs has been strong during the recent silver bull market. Over one year, SILJ returned roughly 224%, compared with 199% for SIL. Over five years, returns have been closer, with SILJ posting 127.46% and SIL returning 122.75%. Investor interest has followed performance. Over the past five years, SIL attracted $1.94 billion in net inflows, while SILJ saw $1.79 billion.
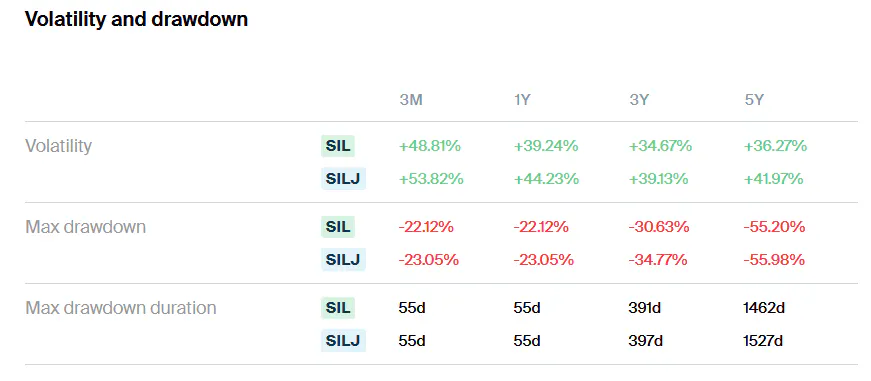
Volatility remains high for both. Over the trailing five-year period, SIL posted volatility of 36.27%. SILJ was higher at 41.97%, reflecting its heavier exposure to junior and mid-cap miners. Maximum drawdowns over that period were similar, at roughly 55% for both funds. Recovery times were long. SIL spent 1,462 days underwater at its deepest drawdown, while SILJ remained below its prior peak for 1,527 days.
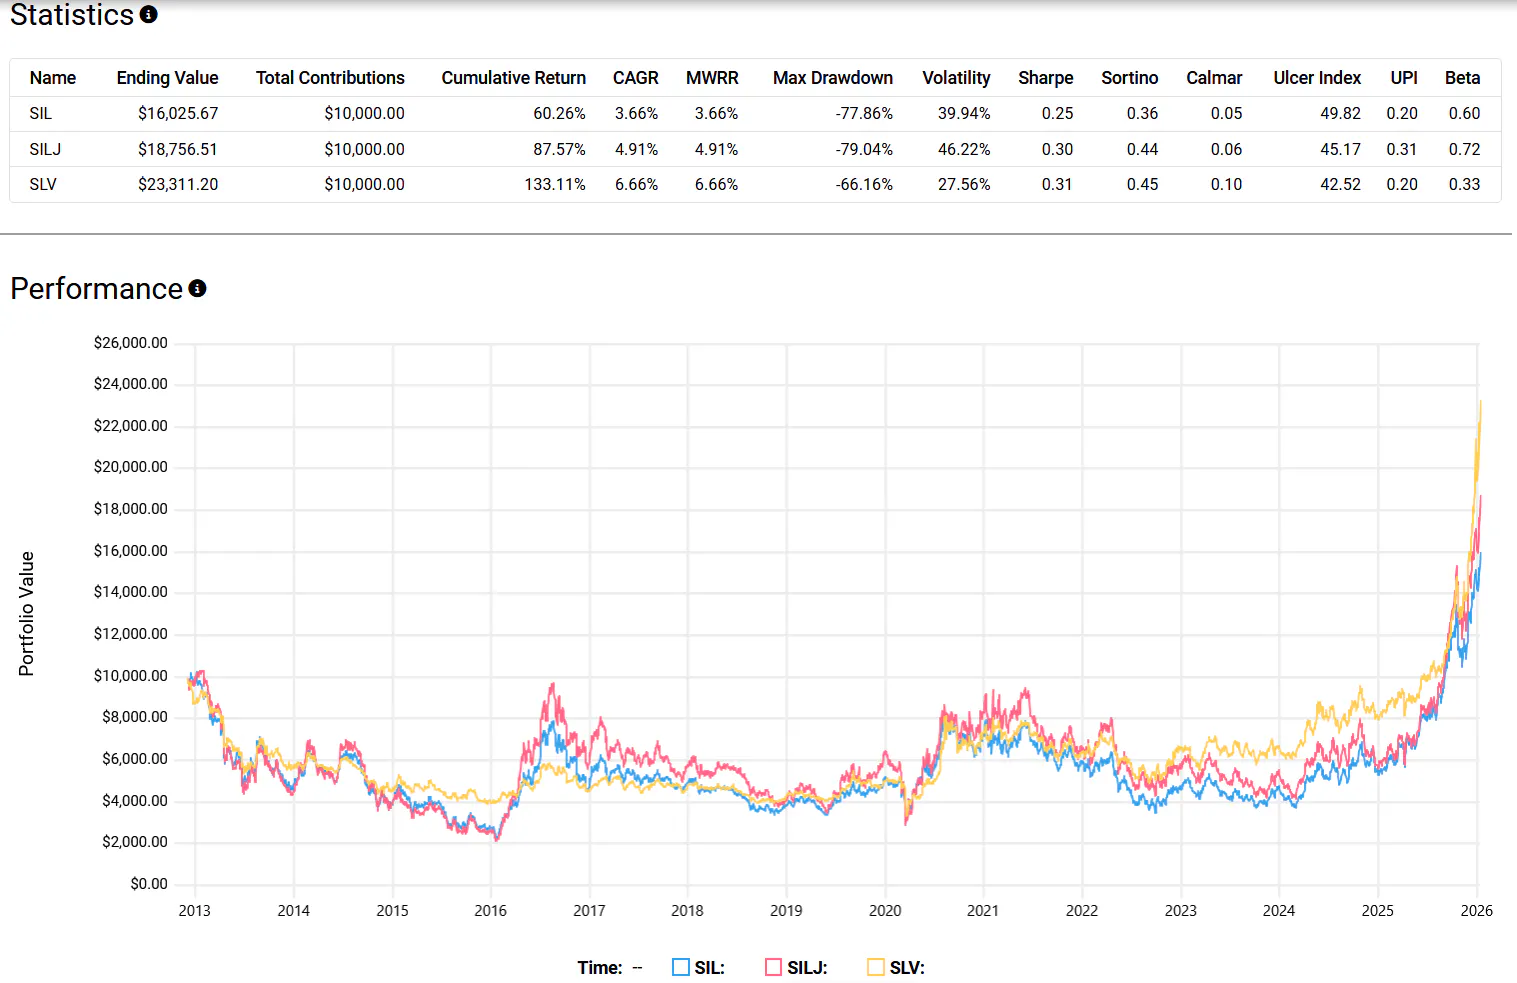
Over longer horizons, both ETFs have underperformed spot silver. From late 2012 through January 2026, SIL delivered an annualized return of 3.66%, SILJ returned 4.91%, while spot silver returned 6.66%. The reason is simple. Leverage works in both directions. Losses compound faster, and larger gains are required to recover. A 10% decline requires an 11% gain just to break even, and those effects worsen over time.
Verdict: SIL remains the more balanced option. It offers leveraged exposure to silver prices without leaning too heavily into speculative juniors. SILJ can outperform sharply in strong bull markets, but the downside risk is substantial. For most investors looking to express a bullish silver thesis, I think SIL is the more manageable starting point.
Please note this article is for information purposes only and does not in any way constitute investment advice. It is essential that you seek advice from a registered financial professional prior to making any investment decision.
Mentioned ETFs
Further reading


Latest ETF News
See all ETF newsThe Two Best Types of Fixed-Income ETFs For Managing Cash

ETF Comparison: Roundhill Generative AI & Technology ETF Versus iShares A.I. Innovation and Tech Active ETF

Crypto Income ETFs: Futures, Options, or Staking?

There’s an ETF for That? Air Conditioning Stocks


 Advantages of ETFs over Mutual Funds1/6
Lower Costs
In this guide, we'll explore the advantages of ETFs over mutual funds, giving you valuable insights into why ETFs have gained significant popularity among investors like yourself.
Leveraged ETFs: Unlocking the Potential for Amplified Returns1/6
Understanding Leveraged ETFs
Explore leveraged ETFs: potential for amplified returns & risks. 5 ETFs to consider across equities, commodities & fixed income.
What is a Leveraged ETF?1/6
Introducing Leveraged and Inverse ETFs
In this guide, we'll dive into the world of leveraged ETFs, exploring their definition, mechanics, potential risks, and rewards.
Recent educational content

ETF Trends
ETF Industry KPIs July 13, 2026
This week’s KPI data overview highlights key metrics and trends shaping the ETF landscape.

First Look ETF
First Look ETF: Cash Deployment, Bond, and Hedged ETFs
In this season 6 episode of First Look ETF, Stephanie Stanton examines the latest ETF marketplace trends with NYSE and guests.

ETF Trends
ETF Industry KPIs July 6, 2026
This week’s KPI data overview highlights key metrics and trends shaping the ETF landscape.

Asset TV
The ETF Show - The Evolution of Leveraged & Inverse ETFs
Leveraged and inverse ETFs have exploded in popularity over the past decade capturing more assets as retail traders seek to capture volatility.

Browse all educational columns

Expert-Built ETF Portfolios, All in One Place
Don’t start from scratch. Discover ready-made ETF portfolios built by professionals to match different goals, timelines, and market views. Use them as inspiration or as a starting point for your own allocation.
