From idea to ETF portfolio in minutes. Build yours now →



Energy Sector Weighed Down by Oil Prices Amid Sluggish World Data
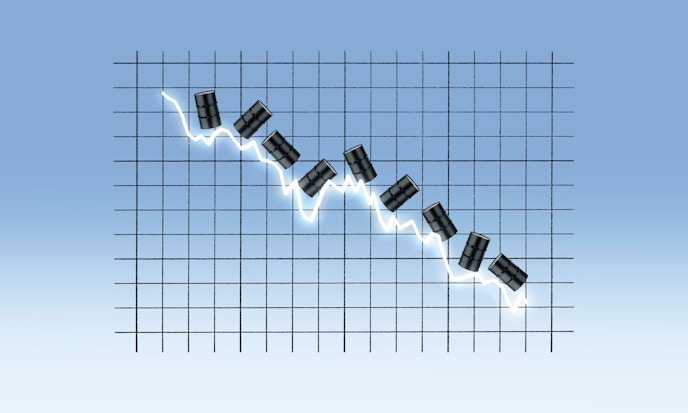
ETF data story for the week of August 21 to 25, 2023: Global energy sector faces instability as WTI Oil price drops due to weak demand, increased US refinery inputs, and poor manufacturing data despite a decrease in US crude inventories.

Keep up with what matters in ETFs
Get timely ETF insights, market trends, and top ideas straight to your inbox.
Your newsletter subscriptions with us are subject to ETF Central's Privacy Policy and Terms and Conditions.
The Energy sector experienced a challenging week, demonstrating the instability of the global economy. The WTI Oil price saw a significant decrease of -1.75% during this period, with this decline largely due to concerns around relatively weak demand and an increase in US refinery inputs.
Indeed, for the week ending August 18, the average US refinery inputs stood at 16.8 million barrels per day, marking an increase of around 30,000 barrels per day compared to the previous week's average. According to the Energy Information Administration (EIA), in total there was a rise of 1.5 million barrels in motor gasoline inventories compared to the prior week.
Poor global manufacturing data added further fuel to the fire. And, despite US crude inventories falling by 6.1 million barrels during the third week of August (as reported by the EIA) this optimistic announcement failed to alleviate investor concerns.
The relationship between demand expectation and production realization is certainly complex and inevitably impacts the prices of WTI Oil. Energy-linked ETFs display high sensitivity towards geopolitical and macroeconomic trends, thus demonstrating their effectiveness as indicators of global economic health.
Like what you're reading?
Stay in the loop — get the latest ETF insights: trends, analysis, and expert picks.



Segments
See all
Mentioned ETFs
Further reading


Latest ETF News
See all ETF newsMoneyShow Chart of the Day 9/4/26: Don't Just Watch Oil. Watch THESE.


Chart of the Day 8/14/26: The Great "Hot Money" Migration

MoneyShow Chart of the Day 7/29/26: Now, THAT's What I Call Market Rotation!

MoneyShow Chart of the Day 7/16/26: Good News/Bad News on Inflation (and the Fed)




 Advantages of ETFs over Mutual Funds1/6
Lower Costs
In this guide, we'll explore the advantages of ETFs over mutual funds, giving you valuable insights into why ETFs have gained significant popularity among investors like yourself.
Leveraged ETFs: Unlocking the Potential for Amplified Returns1/6
Understanding Leveraged ETFs
Explore leveraged ETFs: potential for amplified returns & risks. 5 ETFs to consider across equities, commodities & fixed income.
What is a Leveraged ETF?1/6
Introducing Leveraged and Inverse ETFs
In this guide, we'll dive into the world of leveraged ETFs, exploring their definition, mechanics, potential risks, and rewards.
Recent educational content

ETF Trends
ETF Industry KPIs September 8, 2026
This week’s KPI data overview highlights key metrics and trends shaping the ETF landscape.

ETF Trends
ETF Industry KPIs August 31, 2026
This week’s KPI data overview highlights key metrics and trends shaping the ETF landscape.
ETF Trends
ETF Industry KPIs August 24, 2026
This week’s KPI data overview highlights key metrics and trends shaping the ETF landscape.
What’sTheFund
What's the Fund | Ocean Park Diversified Income ETF (DUKZ)
James St Aubin, Chief Investment Officer at Ocean Park Asset Management, discuss the DUKZ ETF, exposing investors to the whole spectrum of asset classes in the fixed income markets, through their rules-based process.

Browse all educational columns



Build and Analyze Your ETF Portfolio Like a Pro
Create your own ETF portfolio in minutes and instantly see allocations, exposures, performance, and risk. Visualize diversification across asset classes, regions, and sectors. Stress-test ideas, compare benchmarks, and refine your strategy with professional-grade analytics.
