Open Now: The Global ETF Survey Take the Survey →

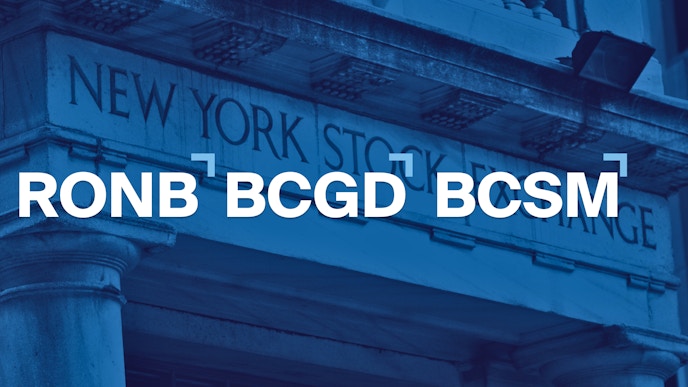
Baron Capital Debuts Three Active ETFs on NYSE
Baron Capital has launched three active equity ETFs on the NYSE, bringing its long-standing growth investment philosophy into an accessible, tax-efficient ETF structure.

Keep up with what matters in ETFs
Get timely ETF insights, market trends, and top ideas straight to your inbox.
Your newsletter subscriptions with us are subject to ETF Central's Privacy Policy and Terms and Conditions.
Baron Capital has launched three actively managed growth equity ETFs on the NYSE, expanding its investment offerings while maintaining the firm’s long-standing growth-focused philosophy.
The new funds include the Baron First Principles ETF
The launch marks an important step for Baron Capital, providing investors and advisors with direct access to the firm’s research-driven approach through an ETF structure. While the wrapper is new, the underlying investment philosophy remains unchanged, grounded in more than four decades of experience investing in secular growth businesses with durable competitive advantages and strong management teams.
“Today’s advisors and investors require specialized active management delivered through accessible, tax-efficient structures, and our new Active ETFs seek to meet that demand,” said Michael Baron, Co-President and Portfolio Manager at Baron Capital.
The ETF Industry Is Evolving Fast
From AI infrastructure to active strategies, the ETF landscape is shifting. Share your perspective in the 7th Annual Global ETF Survey and get exclusive early access to the final report.
How the ETFs Work
Each of the three ETFs applies Baron Capital’s established investment discipline, tailored to distinct segments of the equity market.
The Baron First Principles ETF
The Baron Global Durable Advantage ETF
The Baron SMID Cap ETF
Why Investors Should Consider These ETFs
The three ETFs offer differentiated entry points into Baron Capital’s growth equity investing philosophy, allowing investors to align exposure with their portfolio objectives.
The Baron First Principles ETF
The Baron Global Durable Advantage ETF
The Baron SMID Cap ETF
About Baron Capital
Baron Capital is a research and asset management firm focused exclusively on delivering growth equity investment solutions to institutions, financial advisors, and individual investors. Since its founding in 1982, Baron Capital has been united under one style of investing with a single objective–to be long-term investors in secular growth businesses with durable competitive advantages, run by great management teams. With $44.3 billion in assets under management (as of 11/30/2025) across 19 strategies, Baron Capital prides itself on delivering top performance with 96.1% of Baron Funds AUM outperforming their respective benchmarks since inception (as of 9/30/2025).
For more information, visit https://www.baroncapitalgroup.com/.
Please note this article is for information purposes only and does not in any way constitute investment advice. It is essential that you seek advice from a registered financial professional prior to making any investment decision.
Investors should consider the investment objectives, risks, charges, and expenses of the Baron Funds carefully before investing. The prospectus and summary prospectus contain this and other information about Baron Funds. You may obtain them from its distributor, Baron Capital, Inc., by calling 1-800-99-BARON or visiting BaronCapitalGroup.com. Please read it carefully before investing.
The performance data quoted represents past performance. Past performance is no guarantee of future results. The investment return and principal value of an investment will fluctuate; an investor’s shares, when redeemed, may be worth more or less than their original cost. The Adviser waives and/or reimburses or may waive or reimburse certain Funds expenses pursuant to a contract expiring on August 29, 2036, unless renewed for another 11-year term and the Funds' transfer agency expenses may be reduced by expense offsets from an unaffiliated transfer agent, without which performance would have been lower. Current performance may be lower or higher than the performance data quoted above. For performance information current to the most recent month end, visit BaronCapitalGroup.com or call 1-800-99-BARON.
As of 9/30/2025
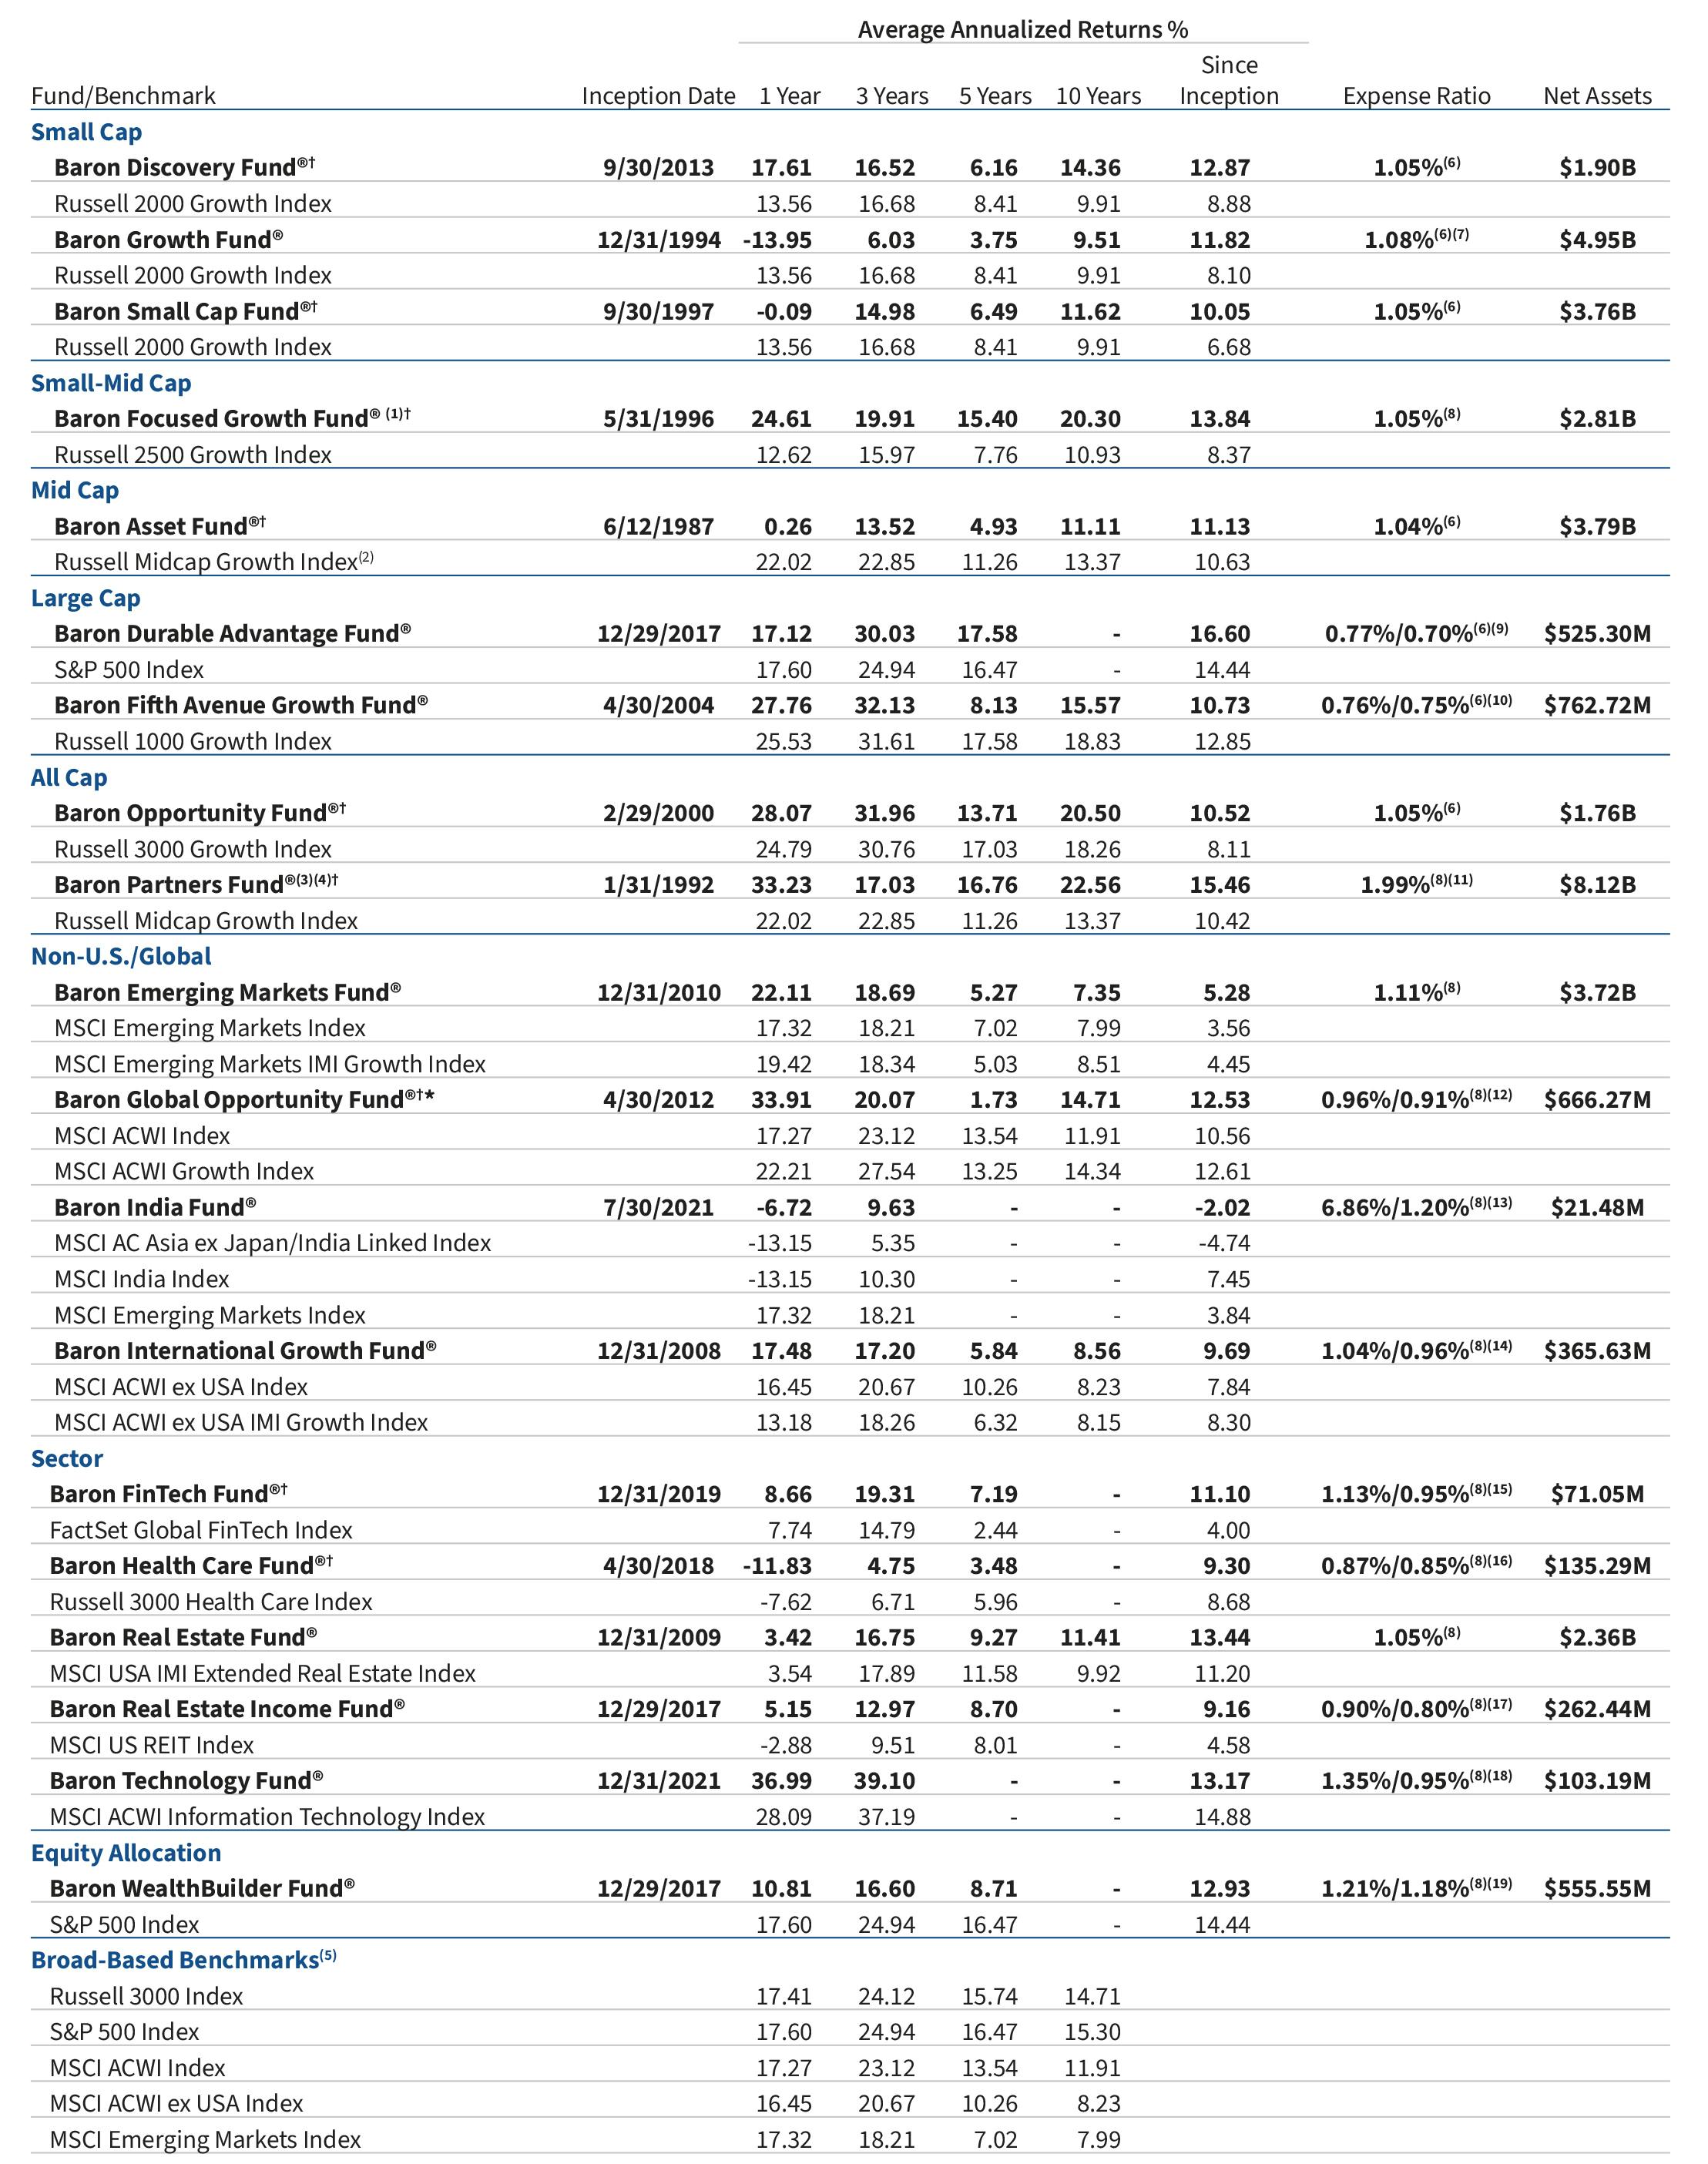
(1) Performance reflects the actual fees and expenses that were charged when the Fund was a partnership. The predecessor partnership charged a 15% performance fee through 2003 after reaching a certain performance benchmark. If the annual returns for the Fund did not reflect the performance fee for the years the predecessor partnership charged a performance fee, returns would be higher. The Fund's shareholders will not be charged a performance fee. The predecessor partnership's performance is only for periods before the Fund's registration statement was effective, which was June 30, 2008. During those periods, the predecessor partnership was not registered under the Investment Company Act of 1940 and was not subject to its requirements or the requirements of the Internal Revenue Code relating to registered investment companies, which, if it were, might have adversely impacted its performance. (2) The since inception date for Russell Midcap Growth Index is 6/30/1987. (3) Performance reflects the actual fees and expenses that were charged when the Fund was a partnership. The predecessor partnership charged a 20% performance after reaching a certain performance benchmark. If the annual returns for the Fund did not reflect the performance fee for the years the predecessor partnership charged a performance fee, returns would be higher. The Fund's shareholders will not be charged a performance fee. The predecessor partnership's performance is only for periods before the Fund's registration statement was effective, which was April 30, 2003. During those periods, the predecessor partnership was not registered under the Investment Company Act of 1940 and was not subject to its requirements or the requirements of the Internal Revenue Code relating to registered investment companies, which, if it were, might have adversely impacted its performance. (4) While the Fund may invest in securities of any market capitalization, 45.8% of the Fund’s long holdings were invested in SMID, Mid and Mid/Large-Cap securities (as defined by Russell, Inc.) as of 9/30/2025 (SMID represents 10.5% of the portfolio and has market capitalizations between $5.4 – $16.8 billion; Mid represents 28.0% and has market capitalizations between $16.8 – $58.2 billion; Mid /Large represents 7.4% and has market capitalizations between $58.2 – $202.7 billion). (5) The Broad-Based Benchmark for Baron Discovery Fund, Baron Growth Fund, Baron Small Cap Fund, Baron Focused Growth Fund, Baron Asset Fund, Baron Partners Fund, and Baron Health Care Fund is Russell 3000 Index. The Broad-Based Benchmark for Baron Durable Advantage Fund, Baron Fifth Avenue Growth Fund, Baron Opportunity Fund, Baron FinTech Fund, Baron Real Estate Fund, Baron Real Estate Income Fund, Baron Technology Fund, and Baron WealthBuilder Fund is S&P 500 Index. The Broad- Based Benchmark for Baron Emerging Markets Fund is MSCI Emerging Markets Index. The Broad-Based Benchmark for Baron International Growth Fund is MSCI ACWI ex USA Index. The Broad-Based Benchmark for Baron Global Opportunity Fund, Baron FinTech Fund, Baron Technology Fund, and Baron WealthBuilder Fund is MSCI ACWI Index. (6) As of 1/28/2025. (7) Comprised of operating expenses of 1.03% and interest expense of 0.05%. (8) As of 4/30/2025. (9) Gross annual expense ratio was 0.77%, but the net annual expense ratio was 0.70% (net of Adviser’s fee waivers). (10) Gross annual expense ratio was 0.76%, but the net annual expense ratio was 0.75% (net of Adviser’s fee waivers). (11) Comprised of operating expenses of 1.05% and interest expense of 0.94%. (12) Gross annual expense ratio was 0.96%, but the net annual expense ratio was 0.91% (net of Adviser’s fee waivers, including interest expense of 0.01%). (13) Gross annual expense ratio was 6.86%, but the net annual expense ratio was 1.20% (net of Adviser’s fee waivers and expense reimbursements). (14) Gross annual expense ratio was 1.04%, but the net annual expense ratio was 0.96% (net of Adviser’s fee waivers). (15) Gross annual expense ratio was 1.13%, but the net annual expense ratio was 0.95% (net of Adviser’s fee waivers). (16) Gross annual expense ratio was 0.87%, but the net annual expense ratio was 0.85% (net of Adviser’s fee waivers). (17) Gross annual expense ratio was 0.90%, but the net annual expense ratio was 0.80% (net of Adviser’s fee waivers). (18) Gross annual expense ratio was 1.35%, but the net annual expense ratio was 0.95% (net of Adviser’s fee waivers and expense reimbursements). (19) Gross annual expense ratio was 1.21%, but the net annual expense ratio was 1.18% (includes acquired fund fees and expenses, net of the expense reimbursements).
If a Fund’s historical performance was impacted by gains from IPOs there is no guarantee that these results can be repeated or that the Funds' level of participation in IPOs will be the same in the future.
† As stated within the Supplement to the Summary Prospectus, Prospectus and Statement of Additional Information dated April 30, 2025, effective October 1, 2025, Baron Global Advantage Fund® has changed its name to Baron Global Opportunity Fund™. For additional information please refer to the Supplement.
Risks: All investments are subject to risk and may lose value.
The discussion of market trends is not intended as advice to any person regarding the advisability of investing in any particular security. The views expressed in this document reflect those of the respective writer. Some of our comments are based on management expectations and are considered “forward-looking statements.” Actual future results, however, may prove to be different from our expectations. Our views reflect our best judgment at the time and are subject to change at any time based on market and other conditions and Baron Capital has no obligation to update them.
BAMCO, Inc. is an investment adviser registered with the U.S. Securities and Exchange Commission (SEC). Baron Capital, Inc. is a broker-dealer registered with the SEC and member of the Financial Industry Regulatory Authority, Inc. (FINRA).
Segments
See all
No specific market segments were tagged
Mentioned ETFs
Further reading
Latest ETF News
See all ETF news


 Advantages of ETFs over Mutual Funds1/6
Lower Costs
In this guide, we'll explore the advantages of ETFs over mutual funds, giving you valuable insights into why ETFs have gained significant popularity among investors like yourself.
Leveraged ETFs: Unlocking the Potential for Amplified Returns1/6
Understanding Leveraged ETFs
Explore leveraged ETFs: potential for amplified returns & risks. 5 ETFs to consider across equities, commodities & fixed income.
What is a Leveraged ETF?1/6
Introducing Leveraged and Inverse ETFs
In this guide, we'll dive into the world of leveraged ETFs, exploring their definition, mechanics, potential risks, and rewards.
Recent educational content

Asset TV
The ETF Show - New Autism-Impact ETF Launched
Defiance ETFs has launched the first ETF, $ASD, focused on the autism ecosystem, investing in companies that provide services, products, and research related to autism and neurodivergence.


ETF Trends
ETF Industry KPIs June 1, 2026
The ETF Industry saw 22 New Launches, 1 Ticker Change and 1 closure last week.
ETF Trends
ETF Industry KPIs May 20, 2026
The ETF Industry saw 44 New Launches, 3 Mutual Fund Conversions and 9 closures last week.

Asset TV
The ETF Show - Politics Becomes Investable Trade through ETFs
Dan Weiskopf, Senior Portfolio Manager at Tidal Financial Group spoke with the ETF Show about Subversive ETFs that help investors trade like politicians.
Browse all educational columns

Active Trader Report: Use of Leveraged & Inverse ETFs Way Up
Direxion partnered with Compound Insights and Vanda to explore what’s driving the evolution of active trading — and how active traders are using leveraged and inverse funds across equities, single stocks, commodities, and volatility.
