ETF model portfolios designed for real investor needs. Discover →



Winners of Q2 2026 REIT Earnings Season
In Part 1 of our Earnings Recap, we highlight the Winners of REIT Earnings Season and the key takeaways from roughly 200 reports across equity REITs, mortgage REITs, and homebuilders over the past six weeks.


Keep up with what matters in ETFs
Get timely ETF insights, market trends, and top ideas straight to your inbox.
Your newsletter subscriptions with us are subject to ETF Central's Privacy Policy and Terms and Conditions.
Summary
- REITs concluded a surprisingly strong earnings season, with 83 REITs - or 83% - raising full-year FFO guidance, just 4% lowering, and the average outlook increasing 1.4% from prior guidance.
Like what you're reading?
Stay in the loop — get the latest ETF insights: trends, analysis, and expert picks.
- Strong Fundamentals, Weak Tape: REITs slipped modestly during earnings season despite widespread guidance raises, as renewed interest-rate pressure outweighed improving property-level trends and earnings momentum.
- Upside standouts included Hotel, Industrial, Data Center, Billboard, Office, Senior Housing/Skilled Nursing, and Single-Family Rental REITs, while Self-Storage finally showed a convincing pricing inflection.
- Dividend Growth Accelerates: OUTFRONT, Terreno, Kimco, Federal Realty, Lamar, and National Health Investors were among the REITs raising dividends during earnings season, reinforcing improving cash-flow confidence.
- Broadening Recovery: Office leasing reached its strongest levels in years, SFR new-lease spreads turned positive, Retail occupancy returned near pre-pandemic levels, and Net Lease acquisition activity accelerated sharply.
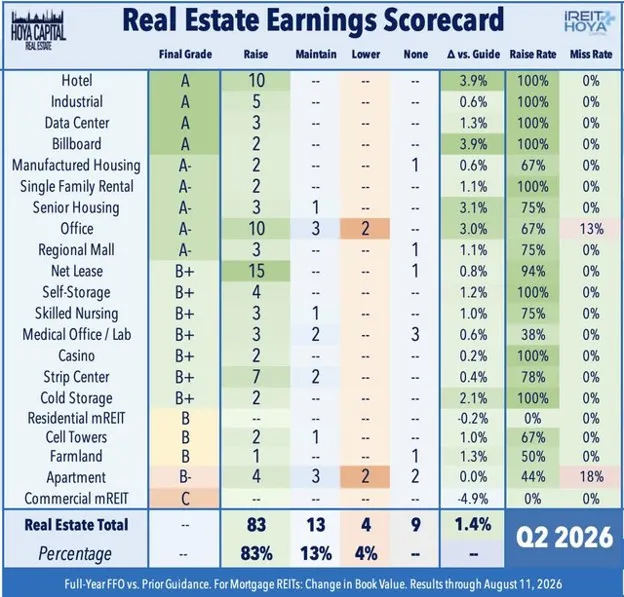
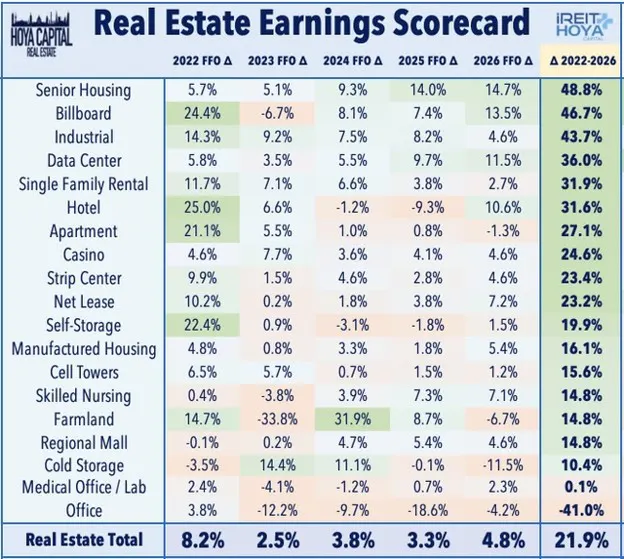
Over 200 U.S. REITs and homebuilders have reported second-quarter earnings results over the past six weeks, providing another critical update on the state of the commercial and residential real estate industry. Overall, REIT earnings results were surprisingly strong and delivered one of the cleanest reporting periods in recent memory, with unusually broad guidance raises, improving property-level fundamentals, and relatively few outright disappointments. Of the 100 equity REITs that provided full-year Funds from Operations ("FFO") guidance, 83 REITs - or 83% - raised their outlooks, while 13 REITs - or 13% - maintained guidance, and just 4 REITs - or 4% - lowered guidance, with an average full-year FFO outlook increase of 1.4% from pre-earnings guidance. Property-level trends were similarly constructive, with stronger leasing activity, improving rent growth, better expense control, and accelerating acquisition pipelines supporting these guidance increases.
Over 200 U.S. REITs and homebuilders have reported second-quarter earnings results over the past six weeks, providing another critical update on the state of the commercial and residential real estate industry. Overall, REIT earnings results were surprisingly strong and delivered one of the cleanest reporting periods in recent memory, with unusually broad guidance raises, improving property-level fundamentals, and relatively few outright disappointments. Of the 100 equity REITs that provided full-year Funds from Operations ("FFO") guidance, 83 REITs - or 83% - raised their outlooks, while 13 REITs - or 13% - maintained guidance, and just 4 REITs - or 4% - lowered guidance, with an average full-year FFO outlook increase of 1.4% from pre-earnings guidance. Property-level trends were similarly constructive, with stronger leasing activity, improving rent growth, better expense control, and accelerating acquisition pipelines supporting these guidance increases.
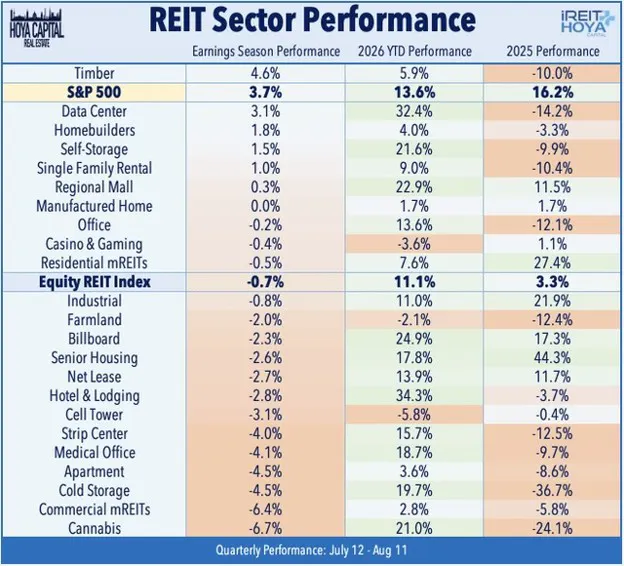
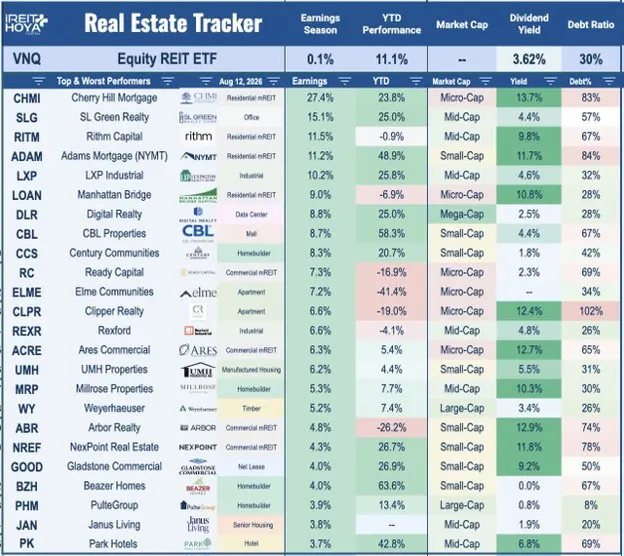
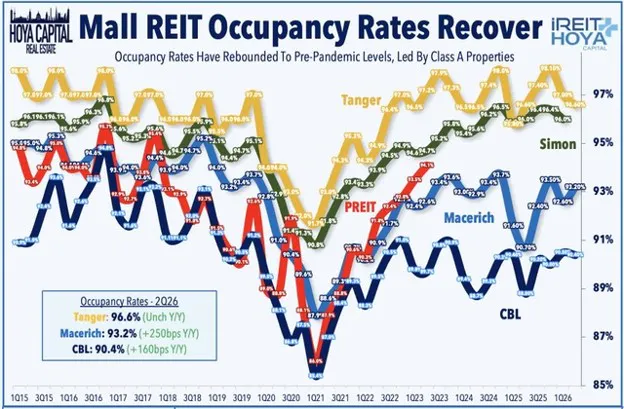
Elsewhere, Senior Housing REITs remained among the sector’s strongest fundamental growth engines, supported by double-digit SHOP NOI growth, improving operator coverage, limited new supply, favorable demographics, and increasingly active acquisition pipelines. Data Center REITs continued to demonstrate exceptional pricing power and AI-related demand, with all three companies raising outlooks and average expected AFFO growth reaching 11.4%, while Digital Realty reported cash renewal spreads above 25%. Net Lease REITs turned in another strong season, with 15 guidance raises as quarterly acquisition volume climbed to $5.7B and cap rates remained near 7.4%, preserving attractive external-growth spreads. Retail fundamentals remained similarly healthy, with Mall REITs reporting occupancy near pre-pandemic levels and strong retailer demand, while Strip Center REITs continued to generate double-digit leasing spreads. Residential trends also became more encouraging: Single-Family Rental REITs saw new lease spreads turn positive and blended growth accelerate, while Apartment REITs reported improving July rents despite a weaker full-year guidance scorecard. Timber REITs emerged as an under-the-radar standout, leading all REIT property sectors during earnings season as recovering lumber prices, stronger Wood Products profitability, and expanding land-monetization opportunities improved the outlook. Across the REIT sector, five names gained more than 10% during earnings season, led by Cherry Hill Mortgage (CHMI), SL Green (SLG), and Rithm Capital (RITM).
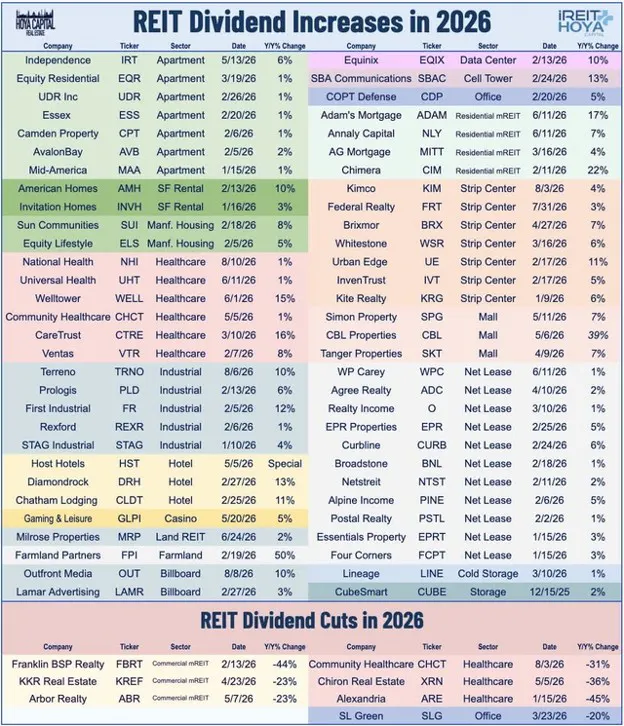
Dividend activity provided another clear indication that the improvement is increasingly translating into shareholder returns. Roughly 60 REITs have now raised their dividends in 2026, with several new increases announced during earnings season. OUTFRONT (OUT) raised its dividend by 10%, Terreno (TRNO) boosted its payout by 10%, Kimco (KIM) increased its dividend by 4%, and Federal Realty (FRT) raised its payout by 3%, while National Health Investors (NHI) bumped up its quarterly dividend by 1%. Omega Healthcare (OHI) also raised its dividend for the first time since 2019, reinforcing the broader improvement in Skilled Nursing operator health and cash-flow coverage. The lone dividend cut came via Community Healthcare Trust (CHCT), which cut its payout by 31% as it redirected capital toward acquisitions. Combined with increased share buybacks, asset sales, deleveraging initiatives, and expanding external growth pipelines, the dividend increases reinforce the broader improvement in REIT total returns. Below, we discuss the sector-level Winners of REIT Earnings Season.
Winner #1: Hotel (Final Grade: A)
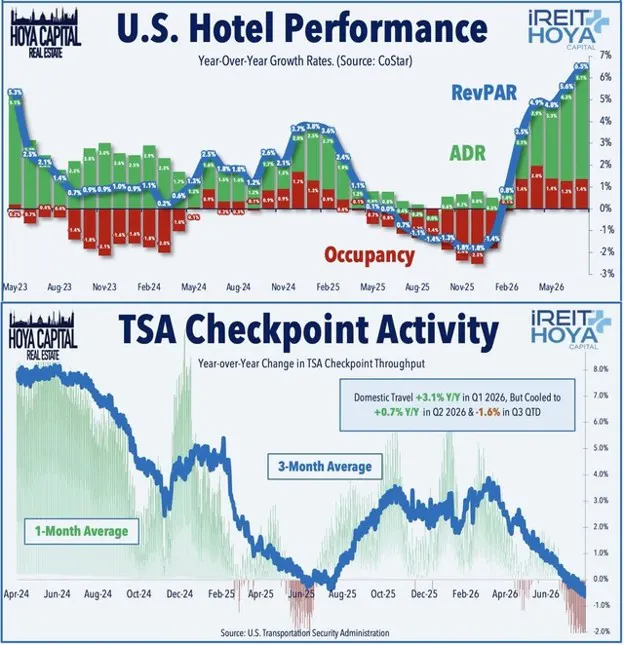
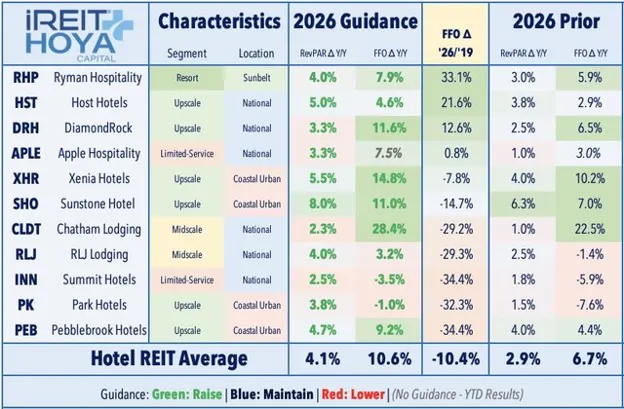
Positives: Hotel REITs delivered the cleanest earnings season in the REIT universe, with a perfect ten-for-ten slate of full-year FFO guidance raises and average expected 2026 FFO growth increasing to 10.6% from 6.7%. RevPAR outlooks were lifted across group, urban, resort, and business-transient portfolios, while better expense control and operating leverage supported stronger margins. The upside was also broad by company, with particularly large revisions from Chatham, Xenia, and DiamondRock.
Negatives: Hotel demand remains the most economically sensitive in the REIT universe, while several REITs still expect earnings below pre-pandemic levels. Higher fuel costs, consumer caution, weaker employment, or softer corporate travel budgets could quickly pressure RevPAR, and the increasingly difficult year-over-year comparisons leave less room for upside surprises.
Best Performer: Park Hotels (PK)
Worst Performer: Summit Hotel Properties (INN)
Winner #2: Data Center (Final Grade: A)
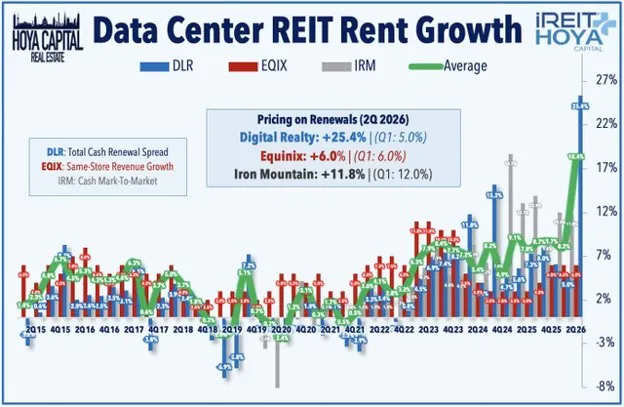
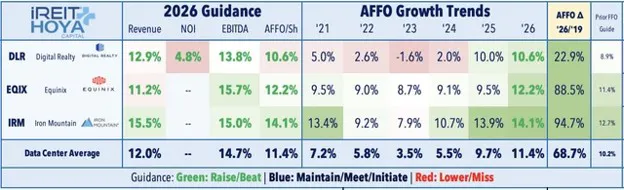
Positives: All three REITs raised guidance as AI, cloud, and enterprise demand continued to overwhelm available capacity. Average expected AFFO growth increased to 11.4%, while Digital Realty posted exceptionally strong renewal pricing, and Equinix continued to deliver steady same-store growth and strong bookings. Development pipelines remain heavily pre-leased, with customer demand continuing to run ahead of available powered capacity.
Negatives: Power availability remains the primary constraint on growth, while massive development pipelines raise capital requirements and execution risk. Valuations remain elevated relative to most REIT sectors, hyperscale leasing can be lumpy, and continued growth increasingly depends on securing power, land, equipment, and financing years ahead of tenant delivery dates.
Best Performer: Digital Realty (DLR)
Worst Performer: Equinix (EQIX)
Winner #3: Industrial (Final Grade: A)
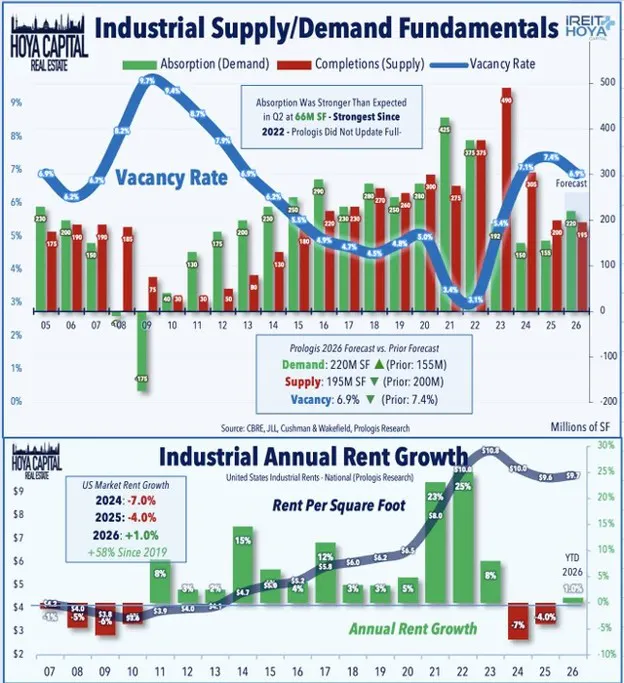
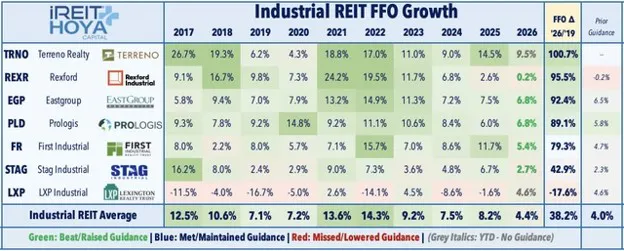
Positives: All five guidance-providing Industrial REITs raised full-year outlooks, with average expected FFO growth improving to 4.4% and same-store NOI expectations increasing to 3.9%. Prologis delivered one of the strongest guidance boosts and provided very positive macro commentary, while EastGroup and First Industrial also raised guidance on resilient leasing and rent spreads. Even Rexford improved its outlook as Southern California showed early signs of stabilization, while moderating development completions are beginning to improve supply-demand conditions.
Negatives: Rent spreads have moderated from the extraordinary pandemic-era pace, especially in Southern California, where market-rent growth remains sharply negative. Larger-user demand remains less consistent, tariff and trade uncertainty can delay decisions, and elevated vacancy will require additional absorption before broad market-rent acceleration returns.
Best Performer: LXP Industrial (LXP)
Worst Performer: STAG Industrial (STAG)
Winner #4: Billboard (Final Grade: A)
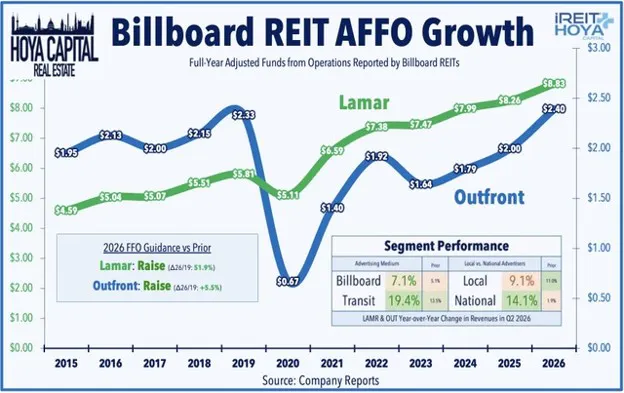
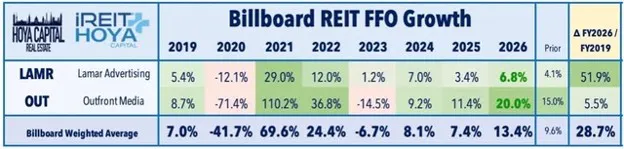
Positives: Both Billboard REITs raised full-year earnings guidance as out-of-home advertising accelerated across billboard, transit, digital, and national advertising channels. Average expected FFO growth jumped to 13.4% from 9.6%, while both Lamar and OUTFRONT also raised dividends, reinforcing confidence in improving cash-flow growth. The weak stock reaction, particularly for OUT, looked more rate-driven than fundamental.
Negatives: OUTFRONT’s expense growth remained elevated as it continued investing in sales, technology, and digital initiatives, limiting some of the benefit from stronger revenue growth. Transit results also benefited from unusually strong event-driven spending, including World Cup-related campaigns, creating tougher comparisons ahead. Both REITs remain exposed to advertising-budget volatility and increasingly difficult year-over-year comps.
Best Performer: Lamar Advertising (LAMR)
Worst Performer: OUTFRONT Media
Winner #5: Office (Final Grade: A-)
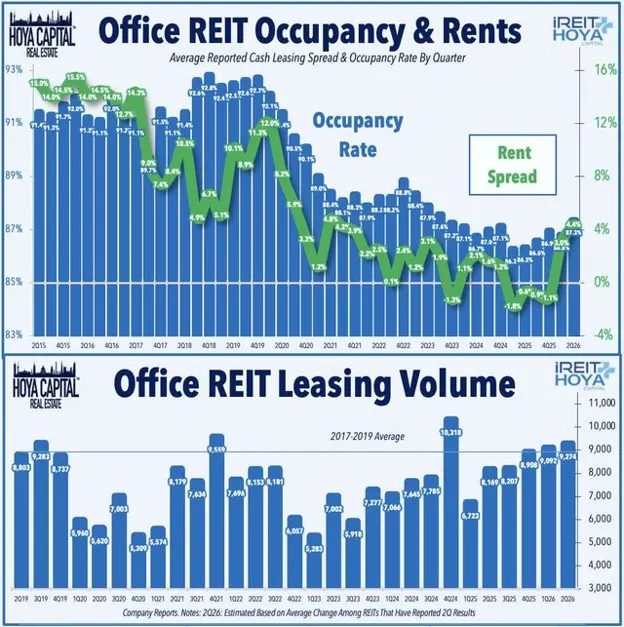
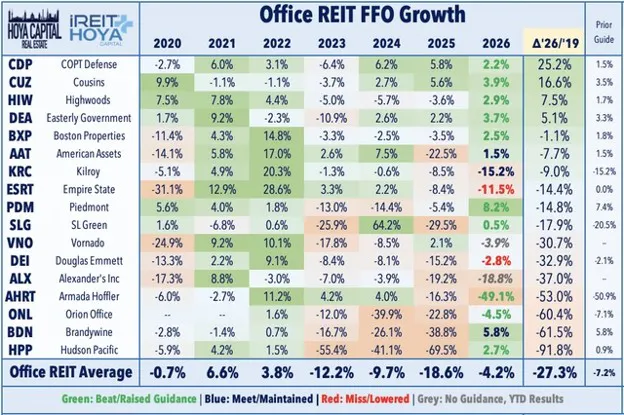
Positives: Ten Office REITs raised full-year FFO guidance as leasing volume climbed above pre-pandemic averages, cash rent spreads turned decisively positive, and occupancy improved. SL Green was the clearest upside standout as Manhattan leasing and pricing strengthened, while BXP, Cousins, and Highwoods also raised outlooks on improving demand. Strength broadened across coastal, Sunbelt, and defense-oriented portfolios, providing the clearest evidence yet that the post-pandemic operating downturn has ended.
Negatives: The recovery remains highly uneven, with several company-specific issues still capable of overwhelming improving sector fundamentals. Empire State Realty lowered guidance as weaker-than-expected Observatory results offset better core office trends, while JBG SMITH plunged after an adverse Wardman Tower ruling that could result in roughly $356M of trebled damages. West Coast occupancy also remains depressed, and refinancing costs continue to weigh heavily on weaker balance sheets.
Best Performer: SL Green
Worst Performer: JBG SMITH (JBGS)
Winner #6: Single-Family Rental (Final Grade: A-)
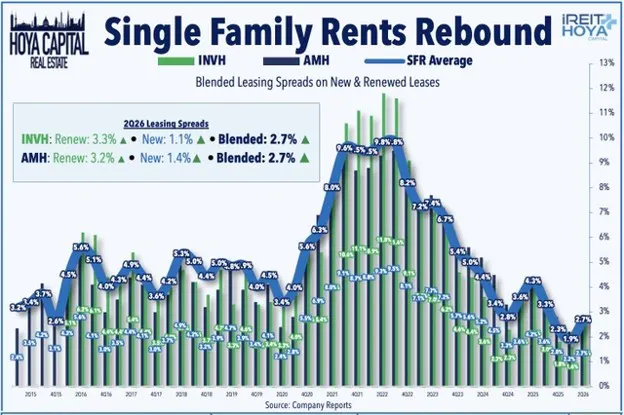
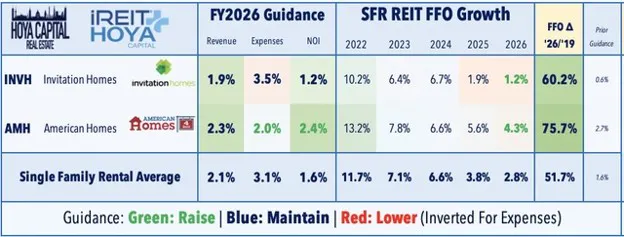
Positives: Both REITs raised full-year FFO guidance as new lease spreads swung back into positive territory and blended rent growth accelerated to 2.7%. Occupancy remains healthy, expense growth is moderating, and development economics continue to benefit from persistently expensive homeownership across major Sunbelt markets. The sector also appears to be moving beyond the worst of the policy overhang, with recent political scrutiny having had little visible impact on operating strategy or demand.
Negatives: Overall rent growth remains far below the extraordinary 2021-2022 pace, while renewal spreads have continued to moderate. Elevated mortgage rates support rental demand but also constrain resident mobility, and affordability pressures could eventually limit landlords’ pricing power. Policy risk has eased as a near-term concern, but the sector remains an easy political target.
Best Performer: American Homes 4 Rent (AMH)
Worst Performer: Invitation Homes (INVH)
Winner #7: Manufactured Housing (Final Grade: A-)
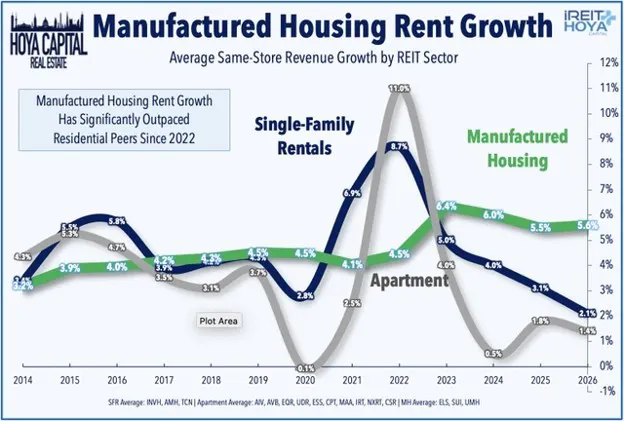
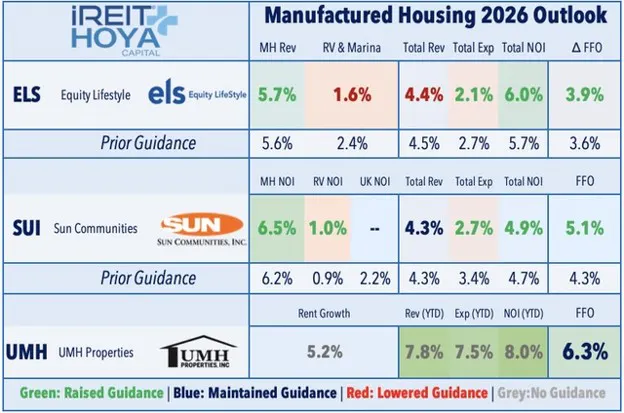
Positives: Both major MH REITs raised full-year FFO expectations as core MH fundamentals remained strong, with high occupancy, durable rent growth, and moderating expense pressure. Equity LifeStyle raised expected FFO growth to 3.9% and same-store NOI growth to 6.0%, while Sun Communities lifted expected FFO growth to 5.1% from 4.3%, led by strong manufactured housing NOI. UMH, which does not provide formal guidance, also posted solid growth and gained roughly 6% during earnings season, easily leading the group.
Negatives: The weaker areas remain outside the core manufactured housing business, with RV, marina, and other discretionary exposure still more economically sensitive and growing at a slower pace. Sun Communities also continues through a broader portfolio transition, while higher financing costs have limited some external growth opportunities.
Best Performer: UMH Properties (UMH)
Worst Performer: Sun Communities (SUI)
Winner #8: Senior Housing (Final Grade: A-)
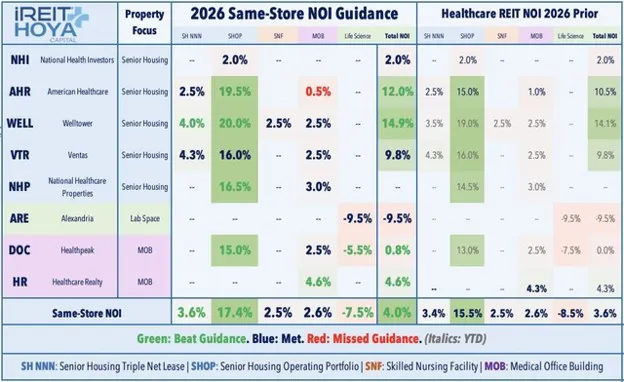
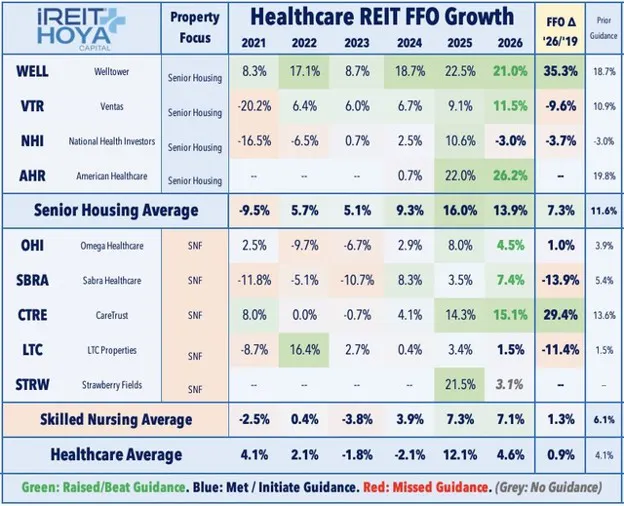
Positives: Six guidance raises across the two healthcare segments, with Senior Housing expected FFO growth approaching 14% and SHOP NOI growth above 17%, while Skilled Nursing operators continued to post improving rent coverage and healthier balance sheets. Welltower and American Healthcare were the clearest Senior Housing standouts, while CareTrust, Sabra, and Omega led the Skilled Nursing group. Limited new supply, favorable demographics, reimbursement trends, and aggressive acquisition pipelines continue to support outsized growth.
Negatives: Expectations are now exceptionally high after several years of outperformance, raising the bar for further upside surprises. Acquisition competition is compressing yields, integration demands are rising, and results remain sensitive to operator execution, labor availability, reimbursement policy, and asset quality. NHI was the notable laggard, with lingering weakness in its legacy SHOP portfolio, while the broader group faces increasing execution risk as acquisition pipelines expand.
Best Performer: Janus Living (JAN)
Worst Performer: National Health Investors
Winner #9: Regional Mall (Final Grade: A-)
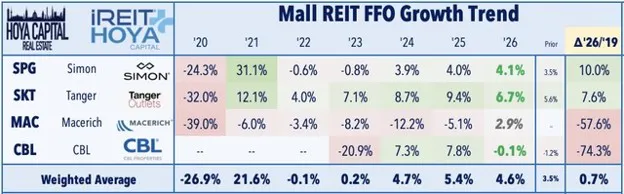
Positives: Three guidance raises, near-pre-pandemic occupancy, accelerating retailer sales, strong leasing volume, and sizable mark-to-market opportunities reinforced the mall recovery. Simon, Tanger, and CBL all lifted earnings outlooks, while exceptionally limited new supply and successful backfilling of bankrupt tenant space continue to strengthen landlord negotiating leverage.
Negatives: Performance remains tied to discretionary consumer spending, retailer profitability, and redevelopment execution, while considerable capital is required to reposition former department stores and weaker anchors. The strongest assets have recovered dramatically, but the gap between dominant Class A properties and lower-quality centers remains wide.
Best Performer: CBL & Associates Properties (CBL)
Worst Performer: Tanger (SKT)
Winner #10: Net Lease (Final Grade: B+)
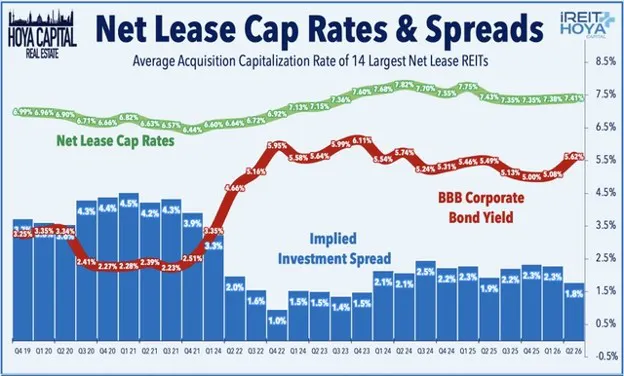
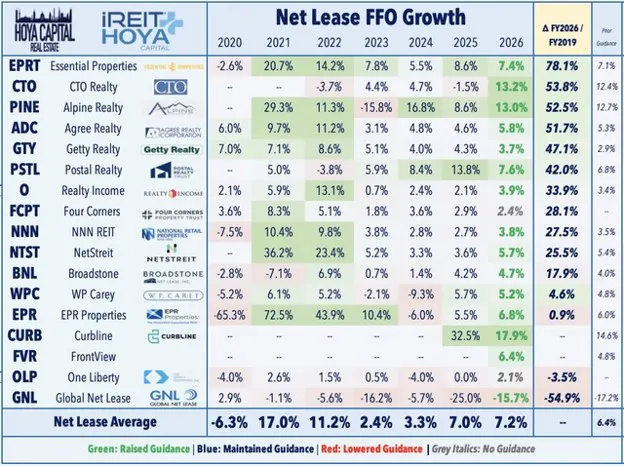
Positives: A perfect slate of fifteen Net Lease REITs raised full-year FFO guidance, with average expected 2026 growth increasing to 7.2% as external growth accelerated across the group. Q2 acquisition volume reached $5.7B, up 18% sequentially and 81% year-over-year, led by a $2.6B quarter from Realty Income. Cap rates held near 7.4%, preserving attractive spreads for the best-capitalized platforms and reinforcing that the sector has moved decisively back into an external growth phase.
Negatives: Organic same-store growth remains modest, leaving acquisitions as the main driver of earnings upside and making the cost of capital especially important. That rate sensitivity was evident during earnings season, with Net Lease REITs falling nearly 3% despite widespread guidance raises as Treasury yields moved higher. Tenant-level credit risk also remains relevant in select casual dining, entertainment, office, and lower-quality retail exposures, while more aggressive acquisition activity raises the importance of underwriting discipline as competition for attractive assets increases.
Best Performer: Gladstone Commercial (GOOD)
Worst Performer: FrontView REIT (FVR)
Winner #11: Timber & Land REITs (Final Grade: B+)
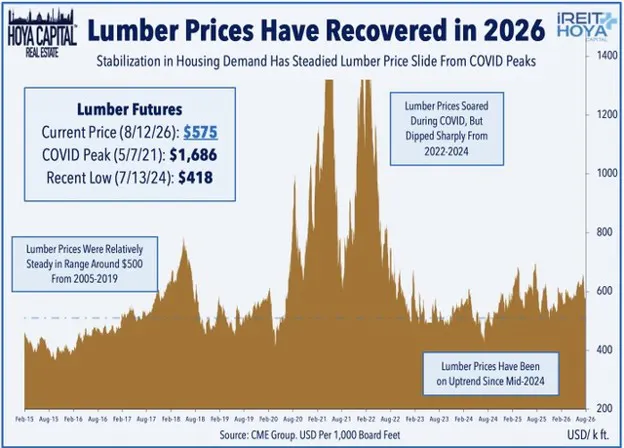
Positives: Timber was the best-performing REIT sector of earnings season, gaining roughly 5% as lumber prices continued their 2026 recovery, and stronger Wood Products profitability complemented healthy timberland values. Weyerhaeuser raised its Strategic Land Solutions outlook, Rayonier maintained a robust real estate pipeline while actively recycling timberlands, and Millrose continued rapidly diversifying its land-banking platform beyond Lennar.
Negatives: Housing activity remains constrained by elevated mortgage rates and affordability pressures, while OSB markets remain oversupplied and Southern pulpwood pricing is still subdued. Timber REITs remain inherently commodity-sensitive, and emerging land-based opportunities carry long development timelines and regulatory uncertainty.
Best Performer: Weyerhaeuser (WY)
Worst Performer: Rayonier (RYN)
Earnings Recap: Winners of REIT Earnings Season
REITs concluded a surprisingly strong earnings season, with 83 REITs - or 83% - raising full-year FFO guidance, just 4% lowering, and the average outlook increasing 1.4% from prior guidance. Hotel, Industrial, Data Center, and Billboard REITs earned perfect A grades, while Office leasing strengthened sharply, SFR pricing turned upward, and Senior Housing and Skilled Nursing remained among the sector’s strongest growth stories. Retail fundamentals continued to improve, while acquisition activity accelerated across Net Lease and Healthcare. The disconnect between fundamentals and stock performance was notable, however, with renewed rate pressure weighing on several otherwise strong sectors. In Part 2, we focus on the relatively small group of laggards, where weakness was often company-specific rather than sector-wide. Meanwhile, M&A activity remained a defining theme of the season, as the private-market bid continued to put a valuation floor under discounted small- and mid-cap REITs while reinforcing the view that public-market pricing remains attractive for opportunistic real estate investors.
Disclosure: Hoya Capital Real Estate advises two Exchange-Traded Funds listed on the NYSE. In addition to any long positions listed below, Hoya Capital is long all components in the Hoya Capital Housing 100 Index and in the Hoya Capital High Dividend Yield Index. Index definitions and a complete list of holdings are available on our website.
About the Author
David Auerbach boasts over two decades of experience in the securities industry, specializing as an institutional trader with a focus on Real Estate Investment Trusts (REITs), Equity and Preferred stocks, MLPs, ETFs, and Closed End Funds.
Based in Dallas, TX throughout his entire career, David currently serves as the Chief Investment Officer for Hoya Capital, managing the Hoya Housing 100 ETF (Ticker: HOMZ) and The High Yield Dividend ETF (Ticker: RIET). Previously, David held the position of Managing Director at Armada ETF Advisors, the sub-advisor for the Residential REIT ETF (Ticker: HAUS) and The Private Real Estate Strategy via Liquid REITs ETF (Ticker: PRVT).
Additionally, he acts as a consultant with IRRealized, LLC, focusing on corporate access in the REIT industry. David's industry journey includes roles at World Equity Group, Esposito Securities, and Green Street Advisors where he got his start in the REIT industry.
At Esposito Securities, he played a crucial role in building the REIT/Real Estate platform and worked extensively with institutional investors, Equity REITs, and ETF issuers.
Throughout his career, David has been quoted by reputable publications such as Bloomberg, WSJ, Financial Times, REIT.com, and GlobeSt.com. He has also made notable appearances as a featured guest on networks like Yahoo Finance, TD Ameritrade, and Bloomberg.
David holds a BBA in Finance from the University of Texas at Austin (May 1999) and an MBA in Finance from Southern Methodist University (May 2005). He maintains FINRA Series 7, 24, 55, and 63 registrations.
In his leisure time, David is an avid traveler, often found crisscrossing the country in pursuit of attending as many Phish concerts as possible.
Disclaimer
Please note this article is for information purposes only and does not in any way constitute investment advice. It is essential that you seek advice from a registered financial professional prior to making any investment decision.

Latest ETF News
See all ETF newsHow Much ETF Infrastructure Do You Really Need?


Are ETFs Getting Too Complicated? Not Necessarily, But Complexity Has a Cost

Form 4 Has 20 Transaction Codes. None Say "Section 351 ETF Swap"


Who Really Owns a White-Label ETF?

What If a Futures-Based ETF Never Had to Roll Again?

How Do You Build a Winning ETF Business?


 Advantages of ETFs over Mutual Funds1/6
Lower Costs
In this guide, we'll explore the advantages of ETFs over mutual funds, giving you valuable insights into why ETFs have gained significant popularity among investors like yourself.
Leveraged ETFs: Unlocking the Potential for Amplified Returns1/6
Understanding Leveraged ETFs
Explore leveraged ETFs: potential for amplified returns & risks. 5 ETFs to consider across equities, commodities & fixed income.
What is a Leveraged ETF?1/6
Introducing Leveraged and Inverse ETFs
In this guide, we'll dive into the world of leveraged ETFs, exploring their definition, mechanics, potential risks, and rewards.
Recent educational content

ETF Trends
ETF Industry KPIs October 5, 2026
This week’s KPI data overview highlights key metrics and trends shaping the ETF landscape.

ETF Trends
ETF Industry KPIs September 28, 2026
This week’s KPI data overview highlights key metrics and trends shaping the ETF landscape.
ETF Trends
ETF Industry KPIs September 22, 2026
This week’s KPI data overview highlights key metrics and trends shaping the ETF landscape.

First Look ETF
First Look ETF: Income, Corporate Arbitrage, and Growth and Value Investing
First Look ETF September 2026: iCapital, Mast Investments and North Square unpack new ETFs targeting monthly income, merger arbitrage and complementary growth and value exposure.

Browse all educational columns



Expert-Built ETF Portfolios, All in One Place
Don’t start from scratch. Discover ready-made ETF portfolios built by professionals to match different goals, timelines, and market views. Use them as inspiration or as a starting point for your own allocation.