ETF model portfolios designed for real investor needs. Discover →



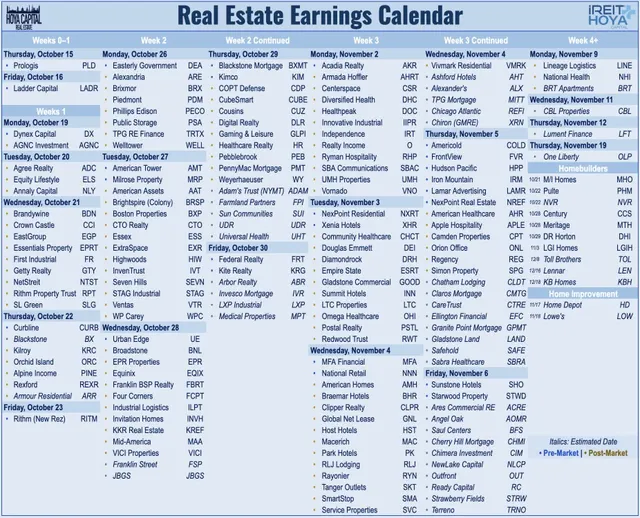
What To Watch This REIT Earnings Season - Q3 2026
A sector-by-sector preview of Q3 2026 REIT earnings: where shrinking supply is helping landlords, and where the rate shock bites.


Keep up with what matters in ETFs
Get timely ETF insights, market trends, and top ideas straight to your inbox.
Your newsletter subscriptions with us are subject to ETF Central's Privacy Policy and Terms and Conditions.
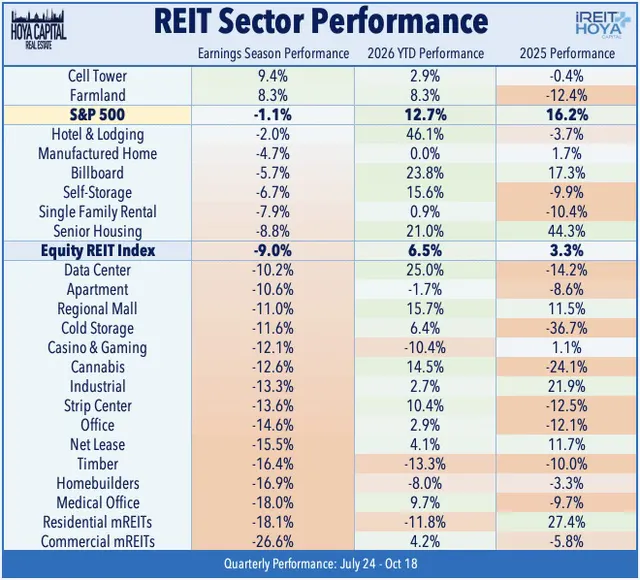
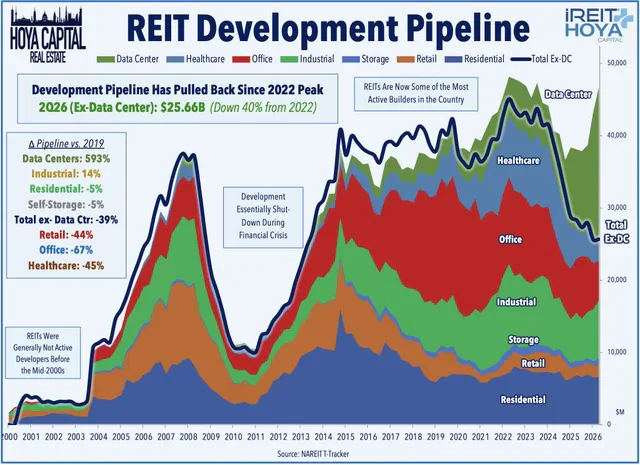
Real estate earnings season kicks into gear this week against a notably more challenging capital-markets backdrop. After holding up surprisingly well through much of the summer, REITs were hit by a renewed surge in long-term Treasury yields that triggered a record-setting seven straight weekly declines and pushed the 10-Year Treasury yield back above 5%. The Equity REIT Index has declined roughly 9% since late July, with the weakness especially severe across rate-sensitive and externally driven sectors. So far, however, the selloff has clearly been much more a valuation and cost-of-capital reset than expectations of any material deterioration in property fundamentals. Higher borrowing costs are raising acquisition hurdles, slowing transaction activity, and reducing the attractiveness of equity issuance, but years of tight financing conditions are also producing an increasingly important offset: development pipelines have contracted sharply across much of commercial real estate. With new supply slowing across several major property types, existing landlords are beginning to benefit from tighter competitive conditions even as demand remains only moderate. The earnings impact from higher rates should also filter through more gradually given the predominantly fixed-rate debt structures and extended maturity profiles across the public REIT sector.
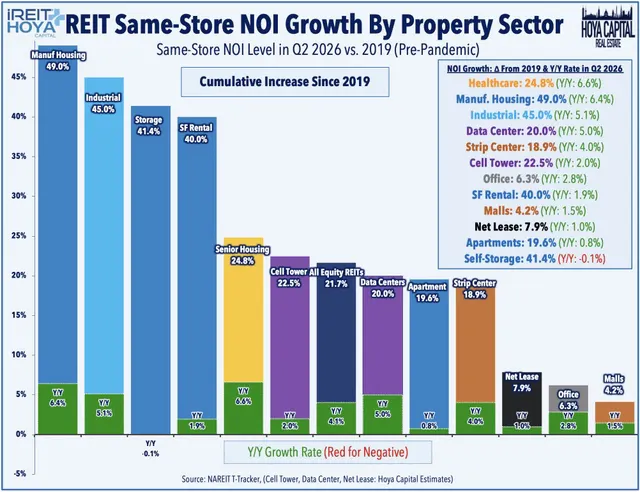
In this report, we focus specifically on property-level fundamentals and the extent to which the recent rate shock is beginning to affect operating trends. Five favorable “green shoots” stand out:
- Senior Housing remains the strongest property-level growth story in the REIT universe, with occupancy continuing to climb while new construction remains exceptionally limited;
- Office fundamentals are showing their clearest recovery since the pandemic as positive absorption coincides with a multi-decade low in new construction and continued inventory reductions through conversions and demolitions;
- Industrial fundamentals continue to improve, with demand again running ahead of completions, vacancy beginning to decline, and elevated development costs limiting the next wave of competitive supply;
- Apartment and Single-Family Rental fundamentals are firming as the post-pandemic multifamily supply wave recedes and new residential construction slows, allowing occupancy and new-lease pricing to stabilize or improve; and
- Consumer-facing real estate has been surprisingly resilient, with Hotel demand holding up better than feared amid very limited new room supply, while Retail vacancy remains near historic lows as virtually nonexistent construction supports rent growth and healthy leasing spreads.
Across these sectors, the common thread is increasingly supply-driven, as the prolonged period of expensive and scarce development capital is finally translating into tighter competitive conditions for existing landlords.
The weaker trends are concentrated in areas most exposed to the abrupt reversal in financing conditions:
- Residential Mortgage REITs face perhaps the biggest near-term question mark after a quarter of unusually sharp rate volatility, with book values, hedging performance, leverage, and dividend coverage all in focus;
- Commercial Mortgage REITs face a more fundamental credit challenge, where the question is increasingly not whether delinquencies rise, but by how much, as the rapid swing from expected easing to substantial tightening pulled the rug out from many "delay and pray" borrowers;
- Data Center fundamentals remain exceptionally strong, but recent AI-related volatility has increased scrutiny of hyperscale spending, tenant credit, and capital intensity;
- higher capital costs are pressuring acquisition economics across Net Lease and other externally driven sectors;
- elevated mortgage rates continue to weigh on Homebuilders and Self-Storage through weak housing turnover; and
- Life Sciences remains one of the few equity REIT sectors still facing clear property-level pressure from elevated vacancy and weak renewal economics.
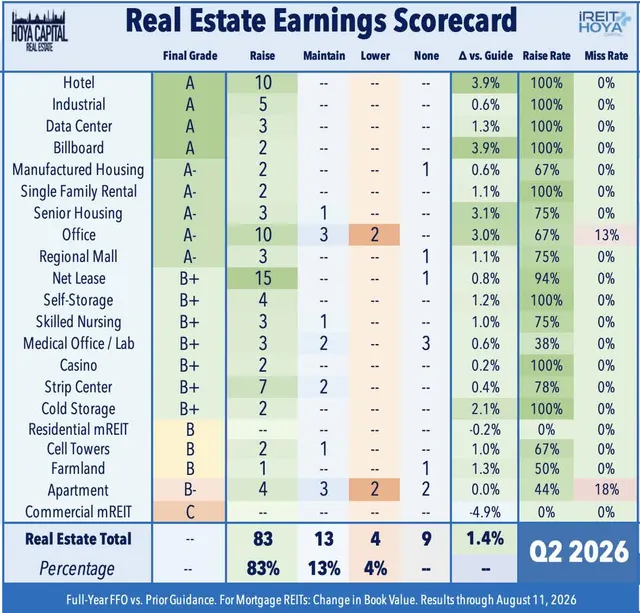
REITs are coming off a very strong second-quarter earnings season in which 83 of the 100 equity REITs providing full-year FFO guidance - or 83% - raised their outlooks, while another 13 - or 13% - maintained guidance and just four - or 4% - lowered, producing an average upward revision of roughly 1.4%. Property-level results were similarly constructive, with broad improvement in leasing, occupancy, rent growth, expense control, and acquisition activity across much of the sector. Hotel, Industrial, Data Center, Billboard, Office, Senior Housing, and Single-Family Rental REITs were among the clearest upside standouts, while Retail fundamentals remained healthy, Apartment pricing continued to firm, and even Self-Storage showed tentative signs of stabilization. The weaker areas remained concentrated primarily in Commercial Mortgage REITs and Life Sciences, where legacy credit issues, elevated vacancy, and delayed recovery timelines continued to weigh on results. The setup entering third-quarter earnings is considerably different, however, following the sharp rise in long-term Treasury yields and the accompanying REIT selloff. With current property fundamentals still broadly healthy, the central question this earnings season is whether the higher-rate environment begins to alter 2027 expectations through higher refinancing costs, tighter acquisition spreads, reduced development activity, slower transaction volumes, and more defensive capital allocation.
Global ETF Survey 2026 is Live!
With 1,790 new products launched by July 2026, choosing is harder than ever. Our Global ETF Survey 2026, built on 620 professional investors and allocators, shows how active, fixed income, options-based and thematic ETFs are reshaping fund selection.
Tech and Industrial REITs Earnings Preview
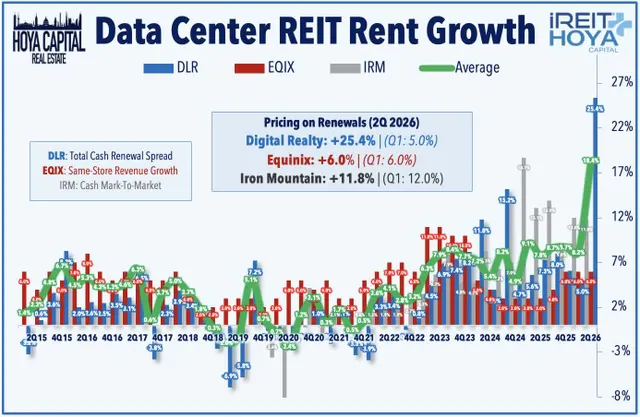
Data Center: Data Center REITs remain among the strongest performing sectors in 2026, despite a recent pullback amid broader volatility across AI-linked equities, as cloud, hyperscale, and AI demand continue to overwhelm the industry's ability to deliver powered capacity. CBRE and JLL estimate that North American vacancy remains near record lows at roughly 1%-1.4%, while preleasing rates remain above 75% across many major markets, meaning that most new capacity is committed well before completion. The primary constraint is increasingly power rather than capital or land, with grid interconnection timelines stretching beyond four years in several major markets and pushing developers toward secondary markets, behind-the-meter generation, and alternative power solutions. Recent REIT results have reinforced the strength of the demand backdrop, with Digital Realty (DLR) ending Q2 with a record $1.9B signed-but-not-commenced annualized rental backlog at 100% share and 25.4% cash renewal spreads, Equinix (EQIX) reporting its second-highest bookings volume on record and record interconnection additions, and Iron Mountain (IRM) reporting more than 50% growth across its Data Center business. The investment debate has nevertheless become more complicated as recent AI volatility has increased scrutiny of hyperscaler spending, tenant credit, development commitments, and the ultimate returns on increasingly capital-intensive infrastructure investment. The sector's central question is therefore still less about whether demand exists and more about whether operators can secure power, deliver capacity on schedule, and earn adequate returns on rapidly rising development costs. This earnings season, we'll focus on leasing volumes, backlog conversion, renewal pricing, power-delivery timelines, development yields, funding requirements, and whether recent AI volatility produces any meaningful change in hyperscale commitments or tenant underwriting.
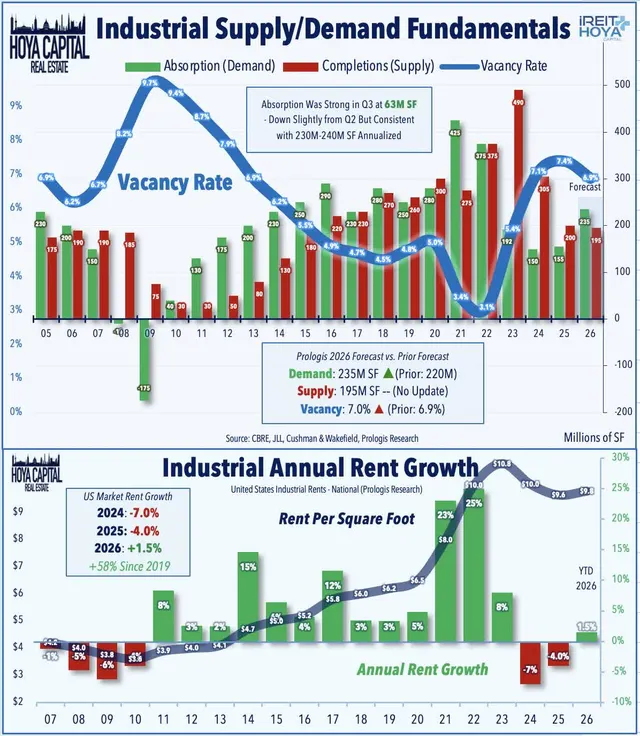
Industrial: Earnings season opened on a constructive note as Prologis delivered another solid quarter and again nudged its full-year outlook higher. More important for the broader sector was the macro read: PLD estimated U.S. net absorption at 63M SF during Q3 and raised its full-year demand forecast to 235M SF from 220M while maintaining its 195M SF supply forecast. Market vacancy declined another 10 basis points to 7.1%, while U.S. rents increased 0.5% sequentially and are now roughly 1.5% higher year-to-date after declining in both 2024 and 2025. Houston, Dallas, Atlanta, Phoenix, Indianapolis, and Northern California have been among the stronger markets, while Southern California continues to stabilize after several years of rent declines. Data-center supply-chain users have also emerged as a meaningful incremental source of demand, accounting for 17% of PLD's new U.S. leasing during the quarter. The question this earnings season is whether PLD's results mark the beginning of a broader industrial inflection or simply reflect the advantages of the sector's largest and highest-quality platform. After two years of rent normalization and rising vacancy, the setup is becoming increasingly supply-driven: development starts have fallen sharply, financing and construction costs remain restrictive, and completions should continue to decelerate into 2027. That makes even modest demand growth increasingly powerful if absorption can remain ahead of deliveries. We’ll be focused on whether peers confirm that vacancy has peaked, whether market rents are turning positive across a wider group of regions, and whether leasing velocity is improving without heavier concessions or shorter lease terms. Development starts and speculative pipelines will also be critical, as a sustained pullback in new construction could extend the next leg of the recovery. Beyond traditional retail and distribution users, we’ll also be watching whether advanced manufacturing, semiconductor, defense, and data-center-related demand is becoming a durable new source of absorption.
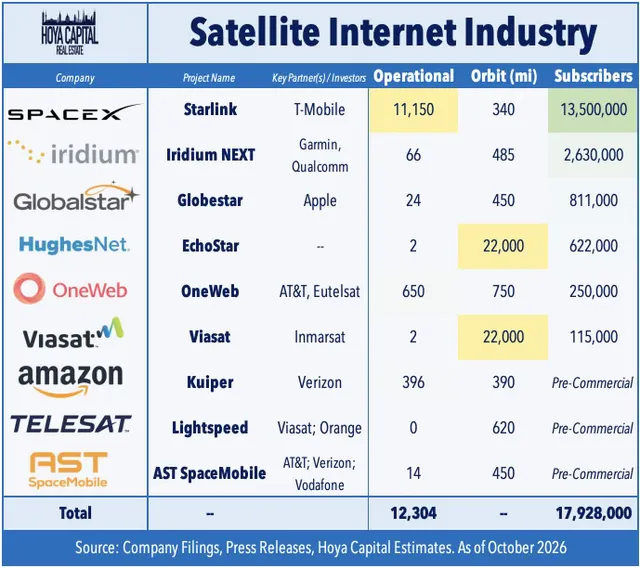
Cell Tower: Cell Tower REITs enter earnings season with a meaningfully different narrative than just three months ago. Years of carrier consolidation, slower post-5G leasing, and concern over satellite competition pushed American Tower, Crown Castle, and SBA Communications roughly 50% below their 2021 highs, but the sector recently staged its strongest rally in years following SpaceX's agreement to acquire approximately $8B of nationwide 800 MHz wireless spectrum. The deal would give Starlink access to valuable low-band spectrum with significantly better indoor penetration and terrestrial coverage characteristics, bringing it another step toward potentially becoming a fourth major U.S. wireless platform. That development could begin reversing one of the most persistent sector headwinds created by the T-Mobile/Sprint merger. Starlink's existing direct-to-device network can provide broad geographic coverage from orbit, but satellite systems still face material capacity, indoor-penetration, latency, and handset-power constraints in dense population centers. A hybrid network would likely require substantial terrestrial infrastructure, creating the possibility that SpaceX eventually becomes a meaningful tower customer rather than simply a competitor. Near-term fundamentals remain more subdued as these REITs continue to work through substantial DISH and Sprint churn, while traditional carrier activity appears to be stabilizing but remains well below the peak 5G deployment cycle. Earnings commentary around leasing backlogs, spectrum deployment, DISH churn, and any early indications of Starlink-related infrastructure demand should therefore carry considerably more weight than in prior quarters.
Hotel, Casino & Office REIT Earnings Preview
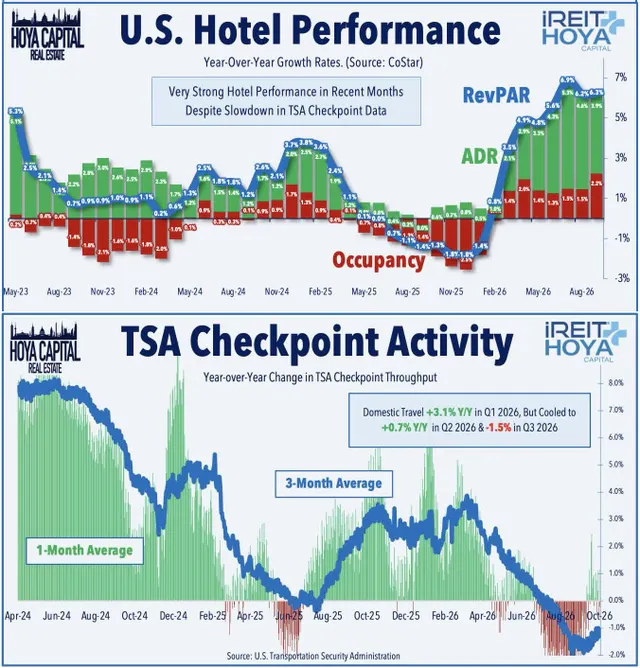
Hotel: The most economically sensitive property sector will again be closely watched for evidence of how consumers and businesses are responding to higher interest rates, elevated energy costs, and a generally less favorable macro backdrop. So far, hotel fundamentals have held up considerably better than feared. CoStar reported that industry-wide Revenue Per Available Room ("RevPAR") increased roughly 6% year-over-year in Q3, driven by a 4% increase in Average Daily Rate ("ADR") and a 2% increase in occupancy. Hotel REITs entered the quarter from an exceptionally strong position after all ten guidance-providing companies raised their full-year FFO outlooks in Q2, with strength extending across urban, resort, select-service, and group-focused portfolios. The more important question this earnings season is whether the broader demand environment can sustain positive RevPAR growth now that the World Cup tailwind has faded. We will be focused on forward booking trends, group and convention demand, corporate travel, urban versus resort performance, and whether consumers are beginning to trade down or shorten stays as higher costs pressure discretionary budgets. Expense growth will also be important, particularly labor, insurance, utilities, and energy costs. With new hotel supply still relatively constrained, even modest demand growth could support healthy occupancy and pricing into 2027, making the supply outlook an increasingly important offset to slower top-line growth.
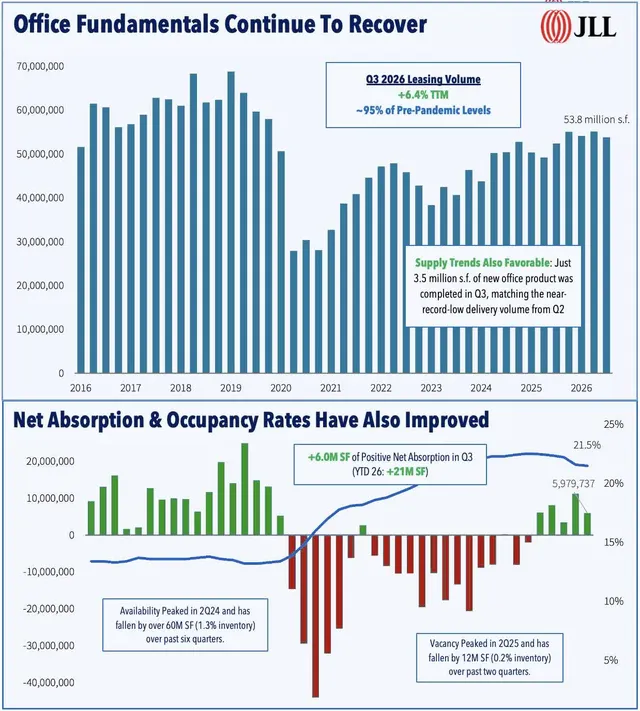
Office: Office fundamentals posted their clearest evidence yet of a broadening recovery during the third quarter, even as sharply higher interest rates disrupted the capital-markets side of the business. JLL reported that leasing volume increased 6.4% over the trailing 12 months, with gateway markets up 13%, while Q3 produced 6.0M SF of positive net absorption and brought year-to-date occupancy gains to 21M SF. The market has now recorded five consecutive quarters of positive absorption, with technology-heavy markets increasingly joining New York and other gateway markets in the recovery. The supply picture has arguably become even more constructive than demand. Just 3.5M SF of new office space was completed in Q3, matching the near-record-low volume from Q2, while 9.6M SF was removed from inventory through conversions and redevelopment. Total U.S. office inventory has declined by more than 45M SF from its late-2023 peak and only roughly 23M-25M SF remains under construction. Asking rents increased 0.6% to $40.51/SF nationally, while trophy and newer Class A properties are generating substantially stronger effective rent growth as availability becomes increasingly scarce. Office investment volume still increased 13% year-over-year in Q3, but elevated rates are likely to slow Q4 sales activity and could delay some leasing decisions if financing conditions remain tight. Q2 REIT earnings were already the most constructive office reporting period in years, with broad guidance increases, better leasing, and positive rent spreads. The third quarter should provide another test of whether this property-level inflection driven by ultra-low supply growth is strong enough to overcome the continued drag from refinancing costs and balance-sheet repair.
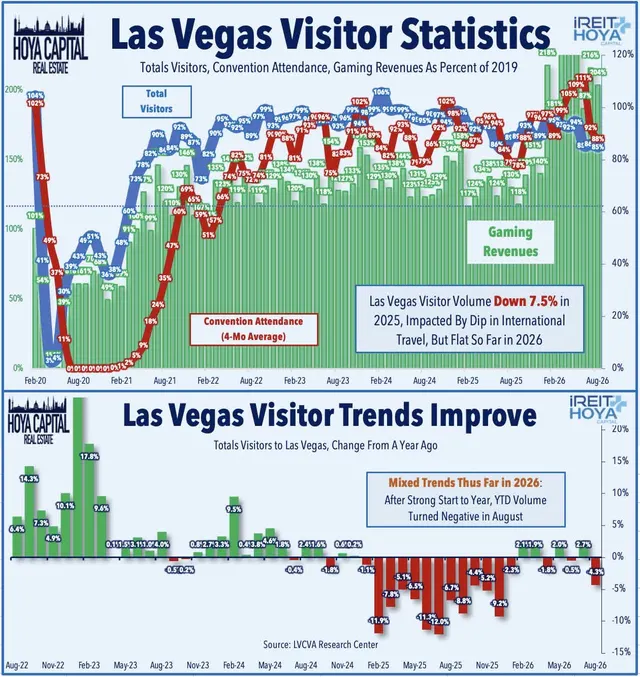
Casino: Casino REIT fundamentals remain largely status-quo, but the focus this quarter shifts more toward tenant health as softer Las Vegas trends and higher financing costs test gaming operators with very different balance-sheet profiles. August Las Vegas visitation declined 4.3% year-over-year, and RevPAR dropped 11.5%, but Strip gaming revenue remained modestly positive. The divergence suggests that the pressure is still concentrated more in lower-end leisure and lodging than in gaming demand broadly, but it nonetheless bears watching for VICI Properties, given its significant exposure to Caesars and MGM. Caesars remains the more notable credit watchpoint because of its higher leverage and greater sensitivity to Las Vegas operating trends, while MGM enters the quarter from a firmer position but still faces sizable capital commitments. For Gaming and Leisure, tenant risk is more concentrated among regional operators, particularly PENN and Bally's, with Bally's the more obvious balance-sheet and execution concern given its aggressive development pipeline. Long-duration master leases and contractual escalators continue to insulate both Casino REITs from near-term swings in operator earnings, and rent coverage remains healthy across the major tenant base. This earnings season, however, the more important question is whether softer consumer trends and higher financing costs begin to erode that cushion at the margin. We'll be watching tenant rent coverage, leverage, capital-spending plans, and whether operators begin pulling back on development or other discretionary investment, particularly at Caesars, PENN, and Bally's.
Residential Real Estate Earnings Preview
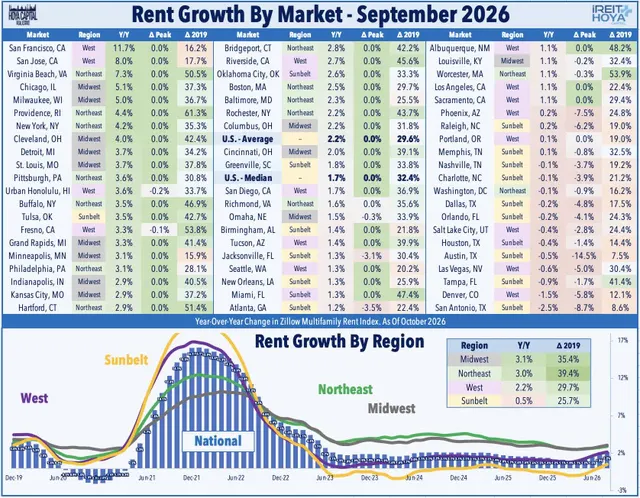
Apartment: The multifamily recovery became more convincing during the third quarter as the post-pandemic construction wave continued to recede, allowing demand to catch up with supply even as leasing activity normalized from an unusually strong spring. RealPage reported that renters absorbed nearly 305,000 conventional apartments over the year ending in Q3, while annual completions slowed to roughly 318,000 units, down 46% from the late-2024 peak. The gap between annual demand and supply narrowed to just 13,000 units, its smallest since 2015, while national occupancy held at 95.4% and turned modestly positive year-over-year for the first time in a year. Same-store effective asking rents increased 0.9% annually, also the first positive reading since Q2 2025. The recovery remains sharply regional. Northern California has swung from one of the weakest markets in the country to the strongest, with RealPage reporting 14.3% annual rent growth in San Francisco, while Midwest markets including Chicago, Milwaukee, Cleveland, and Detroit continue to outperform. Heavy-supply Sunbelt markets remain weaker, with rents still declining in San Antonio, Denver, Charlotte, Tampa, and Houston, although pressure has begun to ease in Austin and Phoenix. Apartment List offers a similarly constructive but still cautious read: national rents were 0.4% below year-ago levels in September, but that compares with a 1.6% decline in April, while vacancy has retreated to 7.0% from its 7.3% peak earlier this year. Last quarter's REIT results had already begun to show this inflection as new-lease spreads improved materially and both coastal and Sunbelt operators reported firmer summer pricing. The supply story is increasingly becoming the dominant theme entering 2027, with development starts collapsing across many of the markets that experienced the most severe oversupply. The third-quarter calls should provide the first meaningful read on 2027 revenue assumptions, particularly whether improving new-lease spreads can finally begin narrowing the unusually wide gap with renewal pricing.
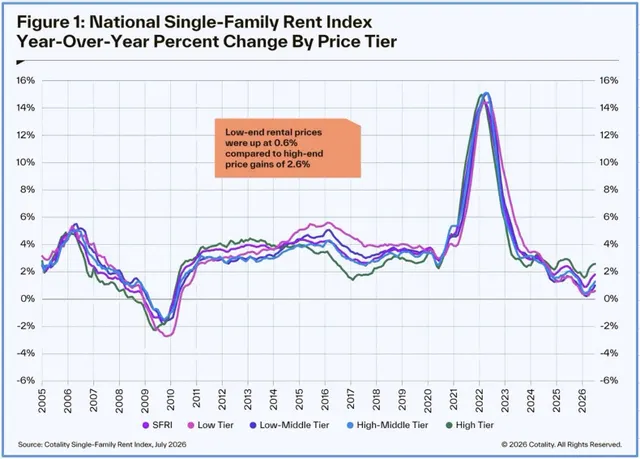
Single-Family Rental: SFR fundamentals also improved through the summer, with national rent growth accelerating for a sixth consecutive month after bottoming earlier this year. Cotality reported that SFR rents increased 2.0% year-over-year in August, returning to the lower end of their longer-term growth range, while just two major markets recorded outright annual declines, the fewest in nearly three years. Pricing remains notably bifurcated by income level, however, with high-end rents increasing 2.8% compared with just 0.8% growth at the lower end. Regional dispersion also remains substantial, led by 4.9% rent growth in Chicago, 3.9% in Philadelphia, 3.7% in New York/Jersey City, and 3.3% in Detroit, while Houston and Dallas remained comparatively soft and two Florida markets continued to report annual declines. Elevated mortgage rates continue to cut both ways for the sector, limiting household mobility and home turnover while also making ownership considerably less affordable and extending renter duration. The policy overhang has also diminished materially in recent months. The 21st Century ROAD to Housing Act restricts incremental purchases of certain existing single-family homes by large institutional owners, but it does not require divestitures of existing portfolios and preserves broad exemptions for build-to-rent development, qualifying renovations, homeownership programs, and transactions between large institutional investors. As a result, the impact on the public SFR REIT model appears more modest than initially feared and is likely to influence the mix of future growth rather than materially alter existing earnings power. This earnings season, we’ll focus on whether the recent improvement in new-lease spreads continues into the fall, along with occupancy, controllable expenses, development yields, and for updated commentary on how the Housing Act will shape the external growth outlook for 2027 and beyond.
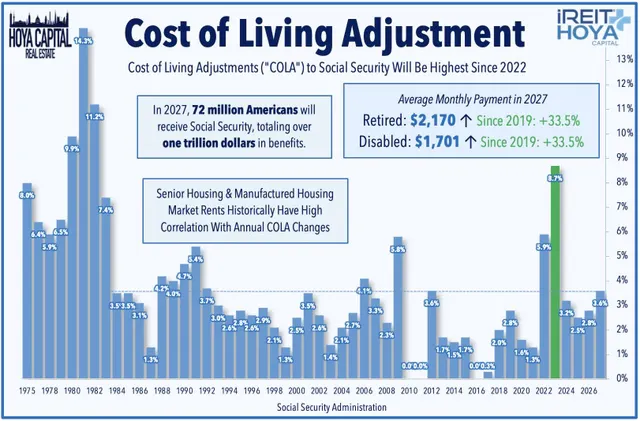
Manufactured Housing: MH REITs continue to generate some of the most consistent residential rent growth in the REIT universe, supported by extremely limited new community development, high resident retention, and a widening affordability advantage versus traditional homeownership. The recently announced 3.6% Social Security COLA for 2027, equivalent to roughly $75 per month for the average retiree, provides another modest tailwind for a resident base that skews older and remains particularly sensitive to increases in housing, insurance, and other essential costs. The strategic picture has also become notably simpler following Sun Communities' completion of the sale of its UK portfolio, so the major publicly traded operators are once again focused overwhelmingly on their core North American manufactured housing businesses, reversing much of the diversification into RV resorts, marinas, and international assets that characterized the prior cycle. That refocus puts the domestic acquisition market back in the spotlight, as the reason MH REITs expanded into adjacent property types was the chronic shortage of domestic MH communities available at attractive prices, which limited external growth and contributed to relatively restrained valuation multiples despite exceptionally stable property-level fundamentals. Higher interest rates might begin to change that equation, as smaller private owners face higher refinancing costs, while leveraged buyers have substantially less attractive financing than they did several years ago, potentially creating acquisition opportunities that have been largely absent from the market. Core MH fundamentals remain strong, while the weaker trends are still concentrated in RV and transient demand, where financing costs and softer discretionary spending continue to weigh on shipments and travel. This earnings season, we'll be particularly focused on whether we see signs of domestic acquisition opportunities, whether cap rates are beginning to adjust enough to support accretive acquisitions, and whether a renewed domestic growth pipeline can become a meaningful catalyst for a sector that has historically been constrained more by a lack of investable supply than by a lack of demand.
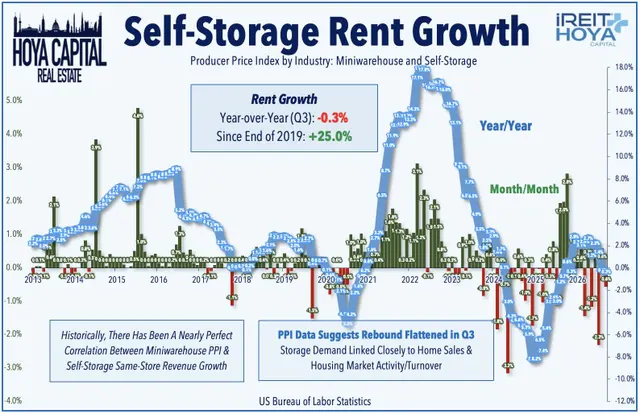
Storage: The tentative self-storage pricing recovery that emerged during the spring lost momentum in the third quarter as weak housing turnover and lingering lease-up supply continued to weigh on move-in demand. Yardi Matrix reported that national advertised rates declined 1.9% year-over-year in August, worsening from declines of 1.6% in July and 1.5% in June. Only a small handful of major metros recorded positive year-over-year advertised rent growth, while occupancy appears to have stabilized but revenue growth remains constrained by the historically wide gap between in-place and street rates. The supply outlook continues to improve, however, with the under-construction pipeline declining to roughly 2.1% of existing inventory as elevated rates and development costs suppress new projects. That should eventually set up a healthier pricing environment, but storage remains dependent on a recovery in moving activity, home sales, and household formation. That said, Q2 earnings were better than the street-rate data would have suggested, as operators leaned on existing-customer rent increases, occupancy management, and expense controls to protect same-store revenue and NOI. Public Storage has also now completed its acquisition of National Storage Affiliates, further concentrating the industry around large operators with meaningful technology, marketing, and operating-scale advantages. The main question is whether those internal levers can continue to offset weak new-customer pricing if the housing market remains frozen into 2027.
Healthcare REIT Earnings Preview
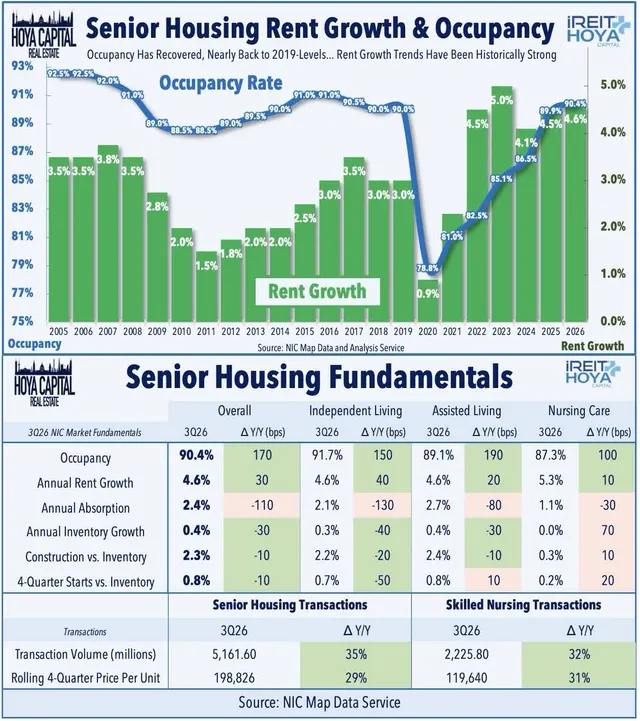
Senior Housing: Senior Housing remains the cleanest property-level growth story in the REIT universe, with the operating cycle strengthening further during the third quarter. NIC reported that senior housing occupancy increased another 60 basis points sequentially to 90.4%, including 91.7% in Independent Living and 89.1% in Assisted Living - effectively marking a full recovery to pre-pandemic levels across the primary markets. More importantly, annual rent growth held at very firm 4.6%, while annual inventory growth remained just 0.4% and construction starts totaled only 0.8% of existing inventory. Q2 earnings showed how powerfully that favorable backdrop is flowing through to REIT-level results. Welltower, Ventas, and Sabra continued to benefit from a combination of rising occupancy, mid-single-digit rent growth, improving labor conditions, and expanding margins. Premium public-market valuations have also created a cost-of-capital advantage that allows these companies to buy assets from private owners at attractive spreads, reinforcing an increasingly powerful cycle of organic and external growth. The recently announced 3.6% Social Security COLA for 2027, equivalent to roughly $75 per month for the average retiree, provides another modest demand-side tailwind that should be enough keep rent growth in the 4-5% range again in 2027. The risk is increasingly one of expectations and execution rather than demand, as acquisition competition has intensified, integration requirements are rising, and outsized development and investment pipelines require disciplined underwriting, but there remains little evidence of a meaningful slowdown in the core operating cycle. This earnings season, we’ll focus on whether that momentum can be sustained through further occupancy gains, margin expansion, and continued consolidation across the sector.
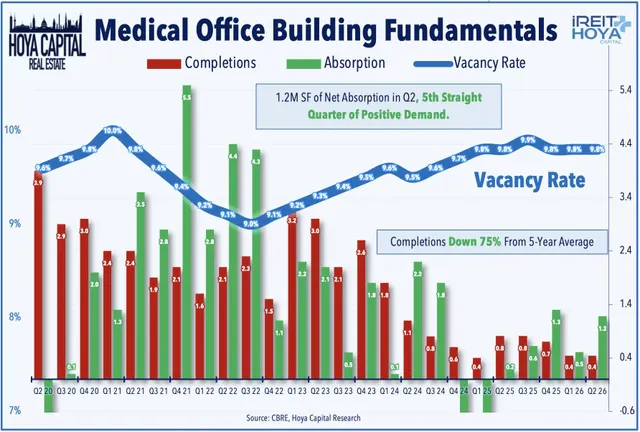
Medical Office: MOB fundamentals remain healthy even while public MOB-focused REITs have been among the hardest hit by the recent rate-driven selloff. CBRE reported 1.18M SF of positive net absorption in Q2, the sector's fifth consecutive quarter of positive demand, while vacancy declined modestly to 9.8% and asking rents increased 1.3% year-over-year to a record $25.46/SF. The development pipeline remains unusually constrained, with only 2.7M SF under construction across the 59 markets tracked by CBRE. The supply outlook is particularly favorable, with just 439K SF of MOB space completed in Q2 - 76% below the five-year quarterly average - with completions declining for four consecutive quarters as elevated construction costs and interest rates suppress new projects. Demand remains supported by healthcare employment growth, with ambulatory healthcare employment increasing 2.7% year-over-year compared with just 0.3% for total nonfarm employment. Private-market liquidity has also improved despite the public-market weakness, as MOB investment volume increased 24% year-over-year to $2.7B in Q2, while cap rates remained essentially stable near 7.1%. Last quarter, Healthcare Realty and Healthpeak showed improving leasing, occupancy, and NOI trends, while private-market transactions reinforced the value of well-located healthcare real estate. This earnings season, we’ll focus on leasing volumes, renewal spreads, occupancy trends, transaction activity, and whether the thaw in private-market pricing can support a more sustained valuation recovery for a sector that still trades at a sizable discount.
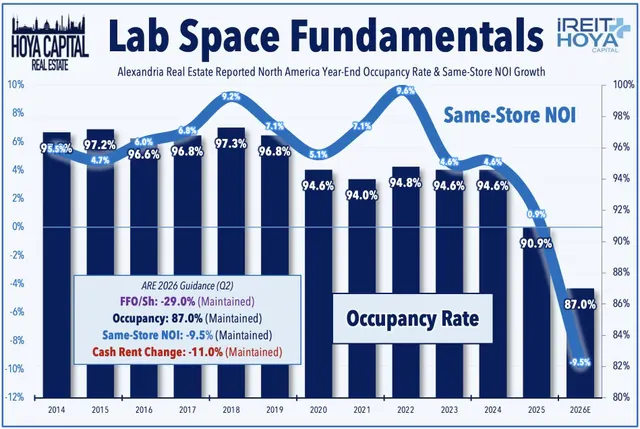
Lab Space: Life sciences remains one of the few equity REIT sectors where the property-level recovery is still troubled by meaningful oversupply. That said, national lab availability appears to have finally begun contracting after peaking in 2025, while recent data suggest that leasing has improved across several of the largest markets. Demand has strengthened most clearly in Boston, the Bay Area, San Diego, and Raleigh-Durham, while AI, robotics, advanced manufacturing, and other alternative users are increasingly absorbing former lab space. Even so, oversupply remains substantial, and tenant leverage remains unusually strong, particularly across older buildings and secondary markets. Alexandria Real Estate illustrated both sides of that story in Q2, as operating occupancy slipped to 86.9% from 87.7% in Q1 and same-property NOI declined 10.6%, but leasing improved modestly. The development pipeline and capital commitments have also been cut sharply, improving the longer-term supply picture and reducing funding needs. The opportunity is therefore increasingly a late 2027 story, at best. Signed-but-not-open leases should begin restoring occupancy, biotech financing conditions have improved, and the collapse in new construction should gradually tighten the market, but large lease expirations, negative renewal spreads, and an unusually deep inventory of competing space remain meaningful hurdles. Leasing volumes, cash renewal spreads, asset sales, and the pace at which committed leases convert into occupied space will remain the critical metrics.
Retail REITs Earnings Preview
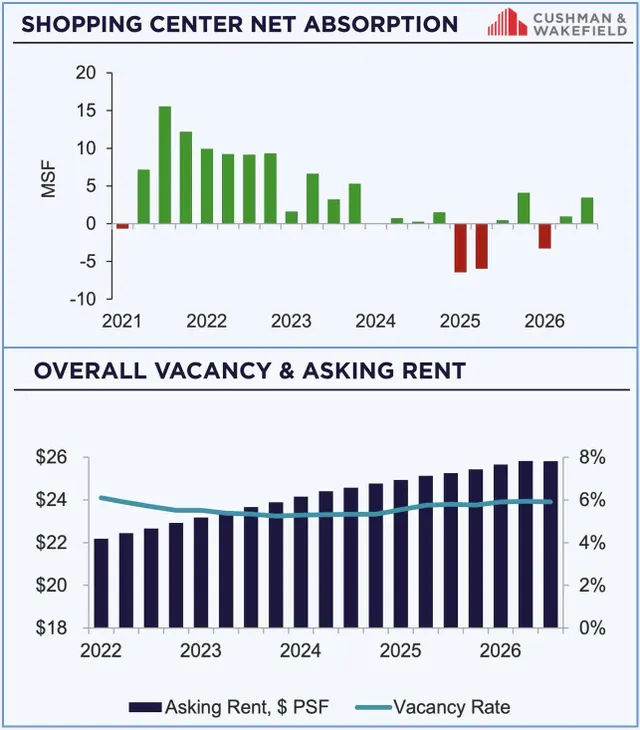
Strip Center: Open-air retail fundamentals remained remarkably resilient through the third quarter despite increased attention on store closures and consumer pressure. Cushman & Wakefield reported that absorption totaled roughly 3.5M SF during Q3, the second-strongest quarterly reading since late 2023 and enough to push year-to-date absorption back into positive territory at 1.2M SF. National vacancy held at just 5.9%, well below its 7.4% historical average, while asking rents increased 2.2% year-over-year to $25.82/SF. Just 2.3M SF of new product was delivered during the quarter and the entire construction pipeline represents only 0.4% of existing inventory, leaving very little competitive supply in the pipeline. The improvement was also reasonably broad geographically, with the West posting positive absorption in every quarter this year and the Northeast recording a particularly strong Q3, while the South remained the only major region to see vacancy increase. Q2 REIT results had already confirmed the strength of the landlord position, with six of nine Strip Center REITs raising full-year FFO guidance and cash leasing spreads averaging in the mid-teens. The M&A market has reinforced that private and institutional capital continues to value grocery-anchored assets, highlighted by BRX and Everview's $2.34B acquisition of Slate Grocery REIT. Consumer conditions have become more bifurcated, but that mix generally favors the open-air REIT tenant base, with grocery, discount, off-price apparel, and health and wellness among the most active sources of leasing demand. This quarter, we'll be focused on whether leasing spreads remain in the double digits, whether signed-but-not-open pipelines continue to support 2027 NOI growth, and whether elevated financing costs begin to slow redevelopment and acquisition activity. Tenant bankruptcies and store closures also bear watching, but with vacancy near historic lows and virtually no new supply, the larger question is whether landlords can continue to recapture weaker space at higher rents rather than whether demand is sufficient to fill it.
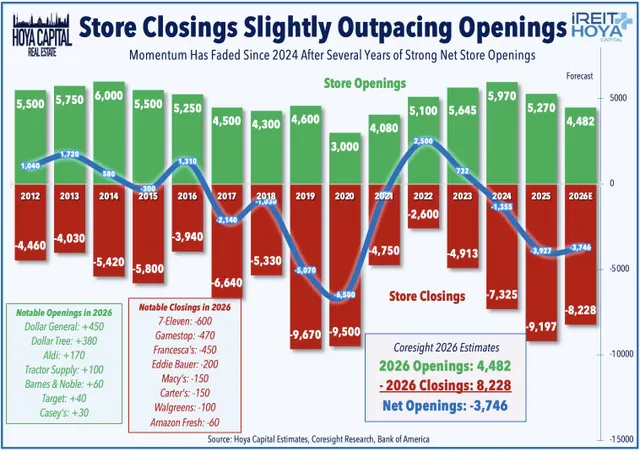
Mall: The mall recovery also remains intact despite renewed concerns over consumer spending. Q2 was one of the strongest mall earnings seasons in years, with Simon, Tanger, and CBL all raising their outlooks as occupancy, tenant sales, and leasing activity improved. SPG's domestic property NOI increased sharply, retailer sales accelerated, and starting rents on new leases remained well above expiring rents, while SKT and CBL continued to benefit from improving occupancy and limited competitive supply. Store-closure headlines remain elevated, but the aggregate space data continue to tell a more constructive story. Announced openings and closures through September imply a net addition of roughly 29M SF of U.S. retail space, illustrating how large new openings by healthy retailers are offsetting many of the smaller and weaker concepts that continue to close stores. The strongest malls continue to benefit from scarcity, high productivity, and the ability to recapture and redevelop former department-store or bankrupt-tenant space at higher rents. The primary risk has shifted back toward the consumer. Higher energy prices and renewed inflation are increasingly pressuring real purchasing power, while discretionary spending remains unusually concentrated among higher-income households. That backdrop should continue to favor dominant Class A malls and outlet centers with affluent trade areas, while lower-quality centers remain more exposed to weaker retailers and redevelopment costs. Expectations for holiday traffic trends, leasing spreads, tenant bankruptcies, and redevelopment returns should be the key indicators during Q3 earnings.
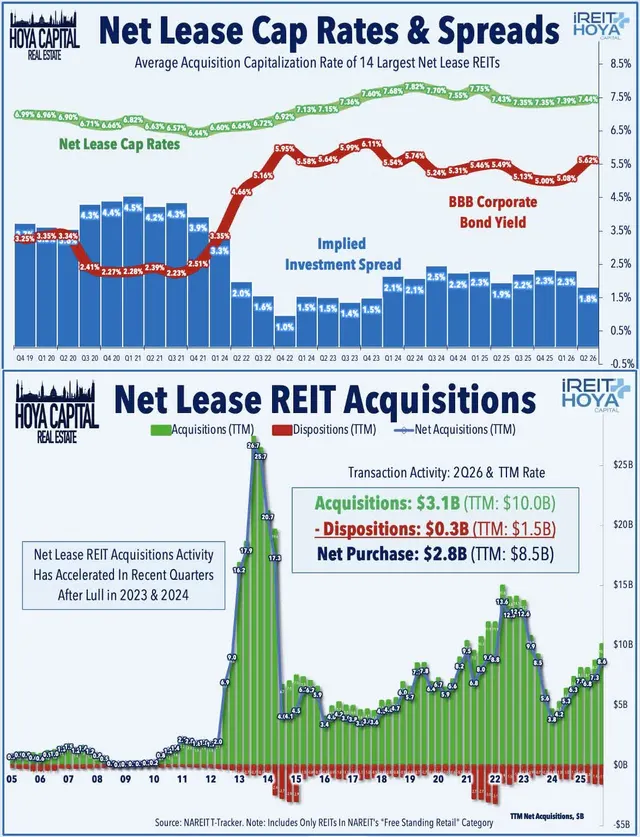
Net Lease: Net Lease REITs enter earnings with perhaps the sharpest disconnect between last quarter's exceptional earnings results and today's capital-markets backdrop. All fifteen guidance-providing Net Lease REITs raised full-year FFO expectations in Q2 as acquisition pipelines accelerated, transaction volume rebounded, and cap rates remained near 7.4%. Average expected 2026 FFO growth rose above 7%, marking a significant return of the external-growth model after several years in which elevated financing costs restricted acquisitions. That equation has become considerably less favorable during Q3. Net Lease REITs have declined 15% since late July as corporate borrowing costs have increased, compressing the investment spread between acquisition cap rates and debt costs from the unusually attractive levels seen earlier in the year. Because organic same-store NOI growth generally runs in the low-single digits, the sector is more dependent than most REIT groups on accretive acquisitions to generate above-average earnings growth. Lower share prices also weaken common equity as acquisition currency and raise the hurdle rate on new investments. The question this quarter is therefore not simply how large acquisition pipelines remain, but whether companies are willing to maintain that pace in a materially different cost-of-capital environment. Better-capitalized platforms should continue to find opportunities, particularly if private sellers begin adjusting cap rates higher, but underwriting discipline and funding sources will matter far more than they did three months ago. Tenant credit remains another watchpoint in casual dining, entertainment, office, and other economically sensitive categories.
Homebuilder & Mortgage REIT Preview
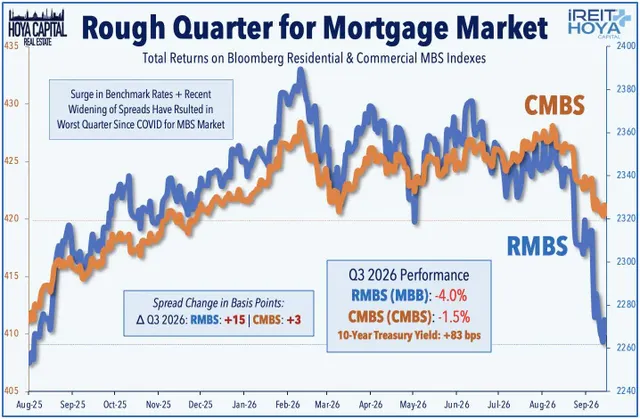
Mortgage: Mortgage REITs endured a dramatically more difficult third quarter than the relatively benign environment seen in Q2. The 10-Year Treasury yield increased 63 basis points during the quarter, while MBS spreads simultaneously widened, particularly on the RMBS side. Unlevered residential MBS returns were -4.0% in Q3 - the worst quarterly performance since the pandemic - while unlevered CMBS finished lower by -1.5%. The resulting pressure was almost certainly magnified across leveraged mREIT portfolios, contributing to one of the sharpest sector selloffs in several years. For Residential mREITs, the primary focus will be book-value preservation, hedge effectiveness, duration exposure, leverage, funding spreads, and dividend coverage. The level of rates matters, but the speed and volatility of the move can be even more consequential because mismatches between assets, liabilities, and hedges can rapidly translate into book-value swings. The Federal Reserve's continued reduction of its mortgage portfolio adds another technical overhang to an already volatile market. Commercial mREITs remain the more fundamental credit concern, as legacy office, multifamily, and life-science loans continue to generate provisions and realized losses at several lenders, while sharply higher rates have again slowed transactions and refinancing activity. Commercial mREITs have declined roughly 27% since late July, by far the weakest segment of the real estate universe, as investors brace for further credit migration and lower book values. Q3 results will be judged on reserves, non-accruals, realized loan resolutions, dividend coverage, and whether the latest rate shock delayed the tentative recovery in new originations.
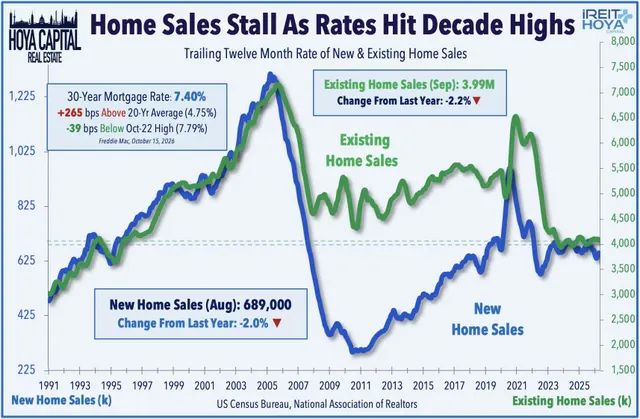
Homebuilders: The brief improvement in housing affordability earlier this year has largely disappeared as mortgage rates surged back toward decade highs. The 30-Year Mortgage Rate reached roughly 7.4% in October, more than 260 basis points above its 20-year average and within roughly 40 basis points of the 2022 peak. Existing-home sales remained stuck near a 4.0M annualized pace in September, down roughly 2% from last year, while new-home sales totaled roughly 689,000 in August and were also modestly lower year-over-year. Limited resale inventory continues to give homebuilders a structural advantage over the existing-home market, but the benefit is becoming increasingly expensive to defend. Mortgage-rate buydowns, closing-cost assistance, smaller floor plans, upgrades, and outright price reductions have become essential tools for sustaining orders, increasingly shifting the earnings question from demand toward margins. Recent results have shown that builders can still move homes, but often only by sacrificing selling prices and gross margins to preserve volumes. The divide by customer segment also remains significant, as entry-level and first-time buyers are the most exposed to mortgage-rate changes and rising insurance costs, while affluent move-up buyers with larger down payments and greater home equity have remained considerably more resilient. Order pace, cancellation rates, incentive usage, gross margins, completed inventory, and commentary on the spring 2027 selling season should therefore dominate the upcoming builder calls.
Key Takeaways: Real Estate Earnings Preview
Real estate earnings season begins with a striking disconnect between public-market performance and underlying property fundamentals, with the operating picture increasingly defined by a clear split between emerging “green shoots” and a smaller group of persistent “red shoots.” On the positive side, years of tight financing conditions are finally translating into meaningfully lower supply. Senior Housing remains the clearest standout as occupancy continues to climb against exceptionally limited construction; Office fundamentals are improving alongside multi-decade-low development and ongoing inventory reductions; Industrial demand is again running ahead of completions; Retail vacancy remains near historic lows; and Apartment and Single-Family Rental fundamentals are firming as the post-pandemic supply wave recedes. Hotel demand has also held up better than expected. The “red shoots” are more concentrated but potentially more consequential. Residential Mortgage REITs face significant uncertainty around the impact of third-quarter rate volatility on book values, hedging, leverage, and dividend coverage, while Commercial Mortgage REITs face a more direct credit challenge as the abrupt shift from expected easing to substantial tightening increases refinancing stress. Housing turnover remains frozen, weighing on Homebuilders and Self-Storage, while Life Sciences continues to face elevated vacancy and weak renewal economics. Data Center fundamentals remain strong, but recent AI volatility has increased scrutiny of hyperscale spending and capital intensity. The key question this earnings season is whether the improving supply backdrop can continue to outweigh a much harsher capital-markets environment heading into 2027.
Disclosure: Hoya Capital Real Estate advises two Exchange-Traded Funds listed on the NYSE. In addition to any long positions listed below, Hoya Capital is long all components in the Hoya Capital Housing 100 Index and in the Hoya Capital High Dividend Yield Index. Index definitions and a complete list of holdings are available on our website.
About the Author
David Auerbach boasts over two decades of experience in the securities industry, specializing as an institutional trader with a focus on Real Estate Investment Trusts (REITs), Equity and Preferred stocks, MLPs, ETFs, and Closed End Funds.
Based in Dallas, TX throughout his entire career, David currently serves as the Chief Investment Officer for Hoya Capital, managing the Hoya Housing 100 ETF (Ticker: HOMZ) and The High Yield Dividend ETF (Ticker: RIET). Previously, David held the position of Managing Director at Armada ETF Advisors, the sub-advisor for the Residential REIT ETF (Ticker: HAUS) and The Private Real Estate Strategy via Liquid REITs ETF (Ticker: PRVT).
Additionally, he acts as a consultant with IRRealized, LLC, focusing on corporate access in the REIT industry. David's industry journey includes roles at World Equity Group, Esposito Securities, and Green Street Advisors where he got his start in the REIT industry.
At Esposito Securities, he played a crucial role in building the REIT/Real Estate platform and worked extensively with institutional investors, Equity REITs, and ETF issuers.
Throughout his career, David has been quoted by reputable publications such as Bloomberg, WSJ, Financial Times, REIT.com, and GlobeSt.com. He has also made notable appearances as a featured guest on networks like Yahoo Finance, TD Ameritrade, and Bloomberg.
David holds a BBA in Finance from the University of Texas at Austin (May 1999) and an MBA in Finance from Southern Methodist University (May 2005). He maintains FINRA Series 7, 24, 55, and 63 registrations.
In his leisure time, David is an avid traveler, often found crisscrossing the country in pursuit of attending as many Phish concerts as possible.
Disclaimer
Please note this article is for information purposes only and does not in any way constitute investment advice. It is essential that you seek advice from a registered financial professional prior to making any investment decision.

Latest ETF News
See all ETF news
Your ETF Is a Tool. Investors Will Decide How to Use It.


How Much ETF Infrastructure Do You Really Need?

Are ETFs Getting Too Complicated? Not Necessarily, But Complexity Has a Cost

Form 4 Has 20 Transaction Codes. None Say "Section 351 ETF Swap"


Who Really Owns a White-Label ETF?


 Advantages of ETFs over Mutual Funds1/6
Lower Costs
In this guide, we'll explore the advantages of ETFs over mutual funds, giving you valuable insights into why ETFs have gained significant popularity among investors like yourself.
Leveraged ETFs: Unlocking the Potential for Amplified Returns1/6
Understanding Leveraged ETFs
Explore leveraged ETFs: potential for amplified returns & risks. 5 ETFs to consider across equities, commodities & fixed income.
What is a Leveraged ETF?1/6
Introducing Leveraged and Inverse ETFs
In this guide, we'll dive into the world of leveraged ETFs, exploring their definition, mechanics, potential risks, and rewards.
Recent educational content

First Look ETF
First Look ETF: Income, International, and Cash Flow ETFs
In this season 6 episode of First Look ETF, Stephanie Stanton @etfguide examines the latest ETF marketplace trends with NYSE and guests.


ETF Trends
ETF Industry KPIs October 5, 2026
This week’s KPI data overview highlights key metrics and trends shaping the ETF landscape.

ETF Trends
ETF Industry KPIs September 28, 2026
This week’s KPI data overview highlights key metrics and trends shaping the ETF landscape.
ETF Trends
ETF Industry KPIs September 22, 2026
This week’s KPI data overview highlights key metrics and trends shaping the ETF landscape.
Browse all educational columns


ETFs’ Next Act: From Access to Selection
With 1,790 new products launched by July 2026, choosing is harder than ever. Our Global ETF Survey 2026, built on 620 professional investors and allocators, shows how active, fixed income, options-based and thematic ETFs are reshaping fund selection.
