Create, analyze, optimize your ETF portfolio. Start now →



U.S. Yield Curve Normalization Signals Economic Resilience
U.S. yield curve normalizes, signaling economic optimism as inflation rises slightly; mixed performance in fixed income ETFs.


Keep up with what matters in ETFs
Get timely ETF insights, market trends, and top ideas straight to your inbox.
Your newsletter subscriptions with us are subject to ETF Central's Privacy Policy and Terms and Conditions.
The U.S. yield curve inversion, which had persisted since mid-2022, ended in September 2024. This marked a pivotal shift in market dynamics, with the gap between 2-year and 10-year Treasury yields recently widening in a positive direction. This change reflects growing optimism about the U.S. economy’s future trajectory.
The Federal Reserve’s monetary easing has contributed to this normalization. With short-term rates declining — the Fed Funds rate now targeted at 4.25% in March 2025 and 4.00% in June — investors are recalibrating their expectations for sustained economic resilience. Meanwhile, rising long-term yields underscore renewed confidence in growth prospects, as the 10-year Treasury yield has steadily increased since late 2024, now standing at 4.40% (+25 bps over the week.)
Like what you're reading?
Stay in the loop — get the latest ETF insights: trends, analysis, and expert picks.
Implications for the U.S. Economy
The steepening of the yield curve carries important implications. Historically, an inverted yield curve has been considered a reliable predictor of recessions. Its recent normalization points to reduced risks of an economic downturn. The widening spread between long- and short-term rates reflects a more optimistic outlook, in line with strong consumer confidence and stable employment levels.
This shift mirrors historical cases, such as the mid-1990s, when a prolonged inversion ended without a recession. The current trend supports expectations of a potential soft landing for the U.S. economy, where inflation is controlled without triggering a significant contraction.
Inflation: A Gradual Rise
Inflation in the U.S. increased slightly in November 2024, marking its second consecutive month of slight increase. The Consumer Price Index (CPI) rose 2.7% year-over-year, up from 2.6% in October. Monthly inflation reached 0.3%, driven largely by housing and food costs. While these figures indicate a manageable rise, they highlight the Fed’s ongoing challenge of balancing price stability with economic growth.
ETF Performance
Fixed income ETFs showed mixed results this week. While the Government IG Long Term segment declined 4.38% last week (recording $1.6 billion outflow), the Government IG Money Market ETFs gained 0.090% over the same period, with over $1.1 billion inflows. Notably, the iShares 20+ Year Treasury Bond ETF
Here’s a comparison between Government Bond ETFs
Group Data
Index Data
Group Data: TLT+0.11%, SPTL-0.04%, TLH-0.03%, EDV+0.29%, ZROZ+0.54%, SCHQ+0.07%, GOVZ
Please note this article is for information purposes only and does not in any way constitute investment advice. It is essential that you seek advice from a registered financial professional prior to making any investment decision.

Latest ETF News
See all ETF newsMoneyShow Chart of the Day 9/4/26: Don't Just Watch Oil. Watch THESE.


Chart of the Day 8/14/26: The Great "Hot Money" Migration

MoneyShow Chart of the Day 7/29/26: Now, THAT's What I Call Market Rotation!

MoneyShow Chart of the Day 7/16/26: Good News/Bad News on Inflation (and the Fed)




 Advantages of ETFs over Mutual Funds1/6
Lower Costs
In this guide, we'll explore the advantages of ETFs over mutual funds, giving you valuable insights into why ETFs have gained significant popularity among investors like yourself.
Leveraged ETFs: Unlocking the Potential for Amplified Returns1/6
Understanding Leveraged ETFs
Explore leveraged ETFs: potential for amplified returns & risks. 5 ETFs to consider across equities, commodities & fixed income.
What is a Leveraged ETF?1/6
Introducing Leveraged and Inverse ETFs
In this guide, we'll dive into the world of leveraged ETFs, exploring their definition, mechanics, potential risks, and rewards.
Recent educational content

ETF Trends
ETF Industry KPIs September 8, 2026
This week’s KPI data overview highlights key metrics and trends shaping the ETF landscape.

ETF Trends
ETF Industry KPIs August 31, 2026
This week’s KPI data overview highlights key metrics and trends shaping the ETF landscape.
ETF Trends
ETF Industry KPIs August 24, 2026
This week’s KPI data overview highlights key metrics and trends shaping the ETF landscape.
What’sTheFund
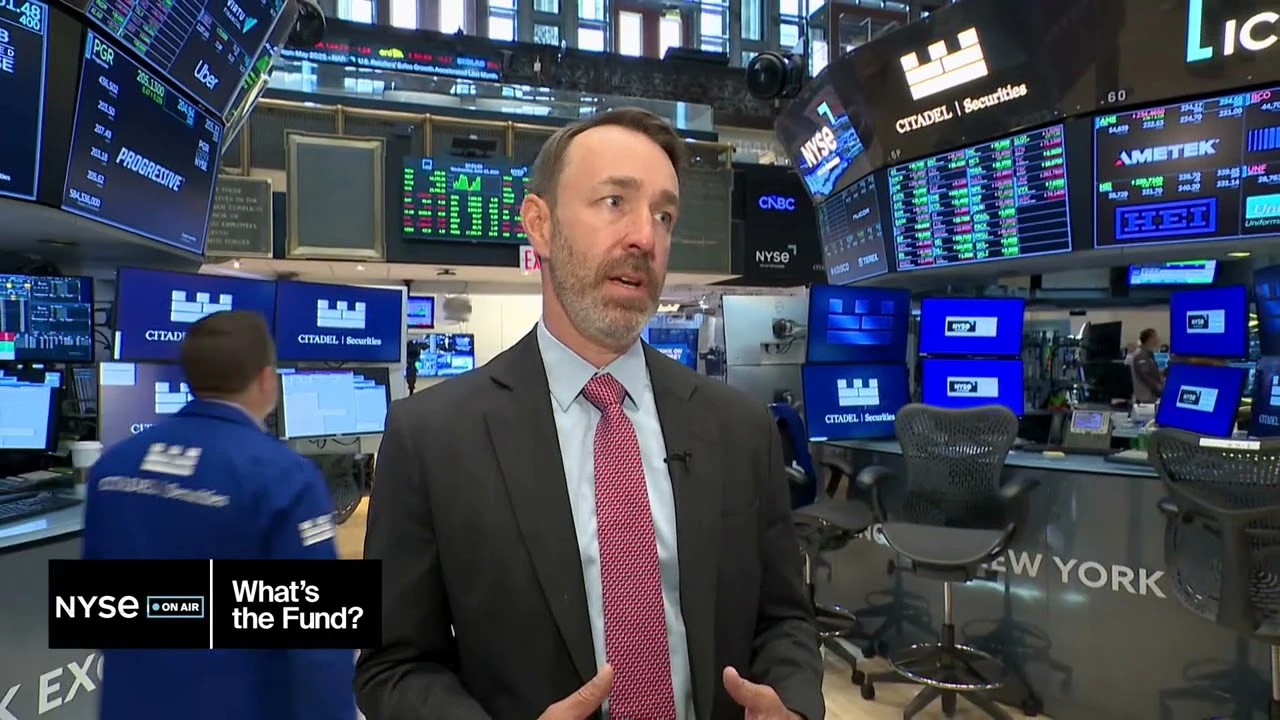
What's the Fund | Ocean Park Diversified Income ETF (DUKZ)
James St Aubin, Chief Investment Officer at Ocean Park Asset Management, discuss the DUKZ ETF, exposing investors to the whole spectrum of asset classes in the fixed income markets, through their rules-based process.

Browse all educational columns



Have you tried our ETF Compare tool?
Compare ETFs like a pro. Analyze fees, performance, exposure & holdings side-by-side.