Turn ETF ideas into real portfolios. Try the builder now →



U.S. Treasuries: Exploring the curve inversion
In this article, we discuss the current yield curve inversion, its relation to a potential recession and relevant ETFs to explore.


Keep up with what matters in ETFs
Get timely ETF insights, market trends, and top ideas straight to your inbox.
Your newsletter subscriptions with us are subject to ETF Central's Privacy Policy and Terms and Conditions.
The yield curve has long been touted as a predictor of recessions, and this has been related to yield curve inversions. Many financial participants believe that when the yield curve inverts – that is, the long-end of the yield curve has a lower yield than the short-end – that a recession is bound to happen. Now, this clearly is not always the case. However, it does depend on the length of the inversion and the level of the inversion.
The U.S. treasuries yield curve has been inverted for the better part of two months now, specifically the 2-year yield vs. 10-year yield slope. This is a classic barometer for gauging whether a recession will occur within the U.S. economy.
Like what you're reading?
Stay in the loop — get the latest ETF insights: trends, analysis, and expert picks.
Implication of curve inversion in U.S. Treasuries
So what does this mean? Again, a yield curve inversion does not necessarily guarantee that there will be a recession. Although, the U.S. economy is already technically in a shallow recession, having experienced two consecutive quarters of negative real GDP growth. However, if inflation were to cool, as it already has shown signs of cooling, the economy may return to growth.
However, several factors in addition to the yield curve inversion may point to a potential recession.
Energy crisis in Europe
First of all, there will almost certainly be a recession in many countries within Europe due to the Russia-Ukraine war and the energy crisis spawned from the conflict. In short, the European Union is working towards banning Russian imports of crude oil in December. In response, Russia has restricted its natural gas exports, making natural gas prices skyrocket in Europe. This has made energy much more expensive for Europeans and will almost certainly damage their economy.
It is noted that economic recessions in one area of the world can cause a ripple effect. The international financial system is highly interlinked and the recessions within Europe may end up having a negative impact on the U.S.
Rising interest rates in the United States
Secondly, inflation has not cooled down as quickly as Americans would have liked. If Americans were told at the end of 2021 that inflation would still be running hot in September, they would likely be very fearful. This has shown up in the financial markets as both bonds and stocks have sold off in favor of cash markets due to the rampant inflation rates and rising interest rates.
This leads to the last point – rising interest rates will increase the likelihood of a recession. However, this has contributed to the inversion of the yield curve since the short-end is rising very quickly. So, it’s not necessarily the inversion of the yield curve that predicts a recession. It is more so that the pressure of a recession has led to a yield curve inversion.
Where to position your capital?
Many economists would expect money market securities to be the best place to position capital in the short-term given the highly uncertain economic conditions, highlighted by high inflation and rising rates. Money-markets can be invested in through ETFs. Some examples of money-market ETFs include:
SHV (iShares Short Treasury Bond ETF)
- AUM: $22.7B
- 1mo Performance: +0.13%
- 1m Flows: +$3.2B
ICSH (iShares Ultra Short-Term Bond ETF)
- AUM: $6.8B
- 1mo Performance: +0.22%
- 1m Flows: +$103M
SGOV (iShares 0-3 Month Treasury Bond ETF)
- AUM: $3.5B
- 1mo Performance: +0.19%
- 1m Flows: +$70M
Data for this article is as of September 8, 2022.
Please note this article is for information purposes only and does not constitute investment advice.
Latest ETF News
See all ETF newsCould Water ETFs Be the Next AI Bottleneck Trade?


What is a Boomer Candy ETF?

ETF Comparison: NEOS Nasdaq-100 High Income ETF (QQQI) Versus Goldman Sachs Nasdaq-100 Premium Income ETF (GPIQ)





 Advantages of ETFs over Mutual Funds1/6
Lower Costs
In this guide, we'll explore the advantages of ETFs over mutual funds, giving you valuable insights into why ETFs have gained significant popularity among investors like yourself.
Leveraged ETFs: Unlocking the Potential for Amplified Returns1/6
Understanding Leveraged ETFs
Explore leveraged ETFs: potential for amplified returns & risks. 5 ETFs to consider across equities, commodities & fixed income.
What is a Leveraged ETF?1/6
Introducing Leveraged and Inverse ETFs
In this guide, we'll dive into the world of leveraged ETFs, exploring their definition, mechanics, potential risks, and rewards.
Recent educational content

ETF Trends
ETF Industry KPIs September 8, 2026
This week’s KPI data overview highlights key metrics and trends shaping the ETF landscape.

ETF Trends
ETF Industry KPIs August 31, 2026
This week’s KPI data overview highlights key metrics and trends shaping the ETF landscape.
ETF Trends
ETF Industry KPIs August 24, 2026
This week’s KPI data overview highlights key metrics and trends shaping the ETF landscape.
What’sTheFund
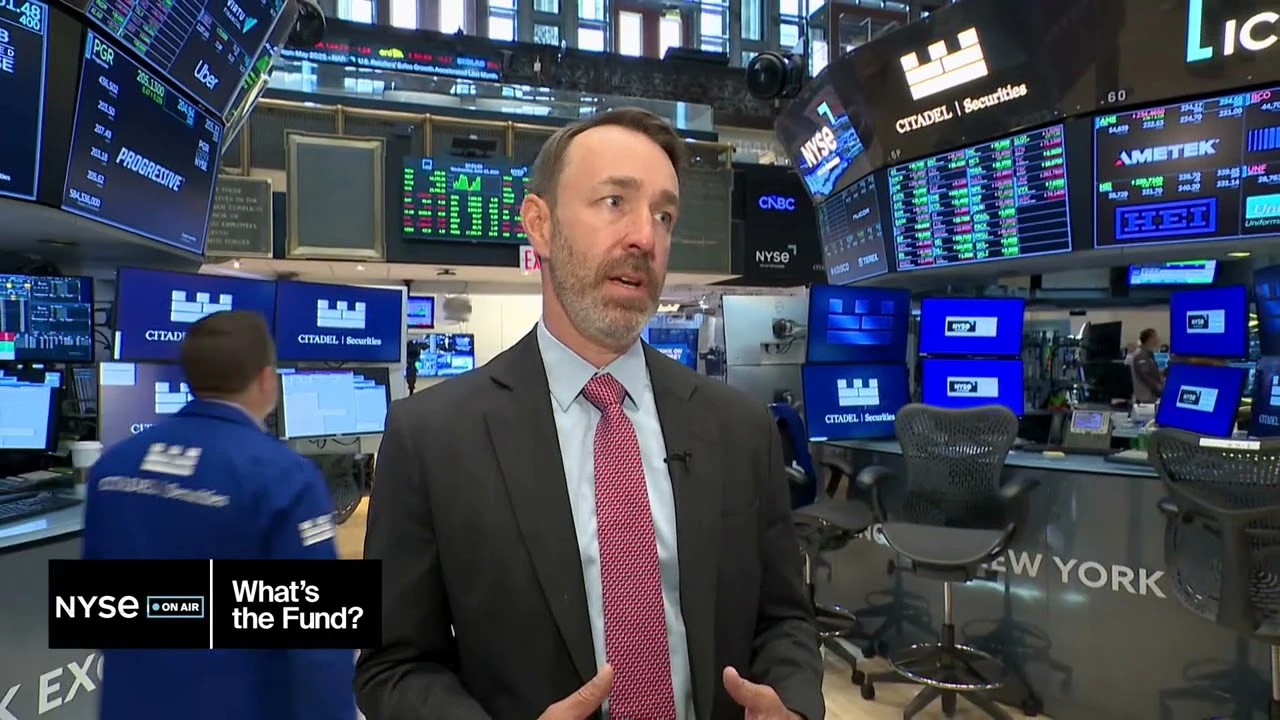
What's the Fund | Ocean Park Diversified Income ETF (DUKZ)
James St Aubin, Chief Investment Officer at Ocean Park Asset Management, discuss the DUKZ ETF, exposing investors to the whole spectrum of asset classes in the fixed income markets, through their rules-based process.

Browse all educational columns



Expert-Built ETF Portfolios, All in One Place
Don’t start from scratch. Discover ready-made ETF portfolios built by professionals to match different goals, timelines, and market views. Use them as inspiration or as a starting point for your own allocation.