From idea to ETF portfolio in minutes. Build yours now →



Trending sub-sectors in 2022
We identified sub-sectors that have been able to weather the recent poor market conditions.


Keep up with what matters in ETFs
Get timely ETF insights, market trends, and top ideas straight to your inbox.
Your newsletter subscriptions with us are subject to ETF Central's Privacy Policy and Terms and Conditions.
2022 has been a wild ride for the markets. With rising inflation and interest rates, declining equity prices, and high uncertainty, it seems that the long-standing bull market is finally over. There are still some pockets of the market where performance can be achieved. However, it takes some digging to identify sub-sectors that have been able to weather the poor market conditions and some that have actually been able to outperform.
Like what you're reading?
Stay in the loop — get the latest ETF insights: trends, analysis, and expert picks.
Sub-sectors explained
To dive into trending sub-sectors, it is important to define what a sub-sector is in the context of investing. The main sectors as defined by the Global Industry Classification Standard (GICS) are:
- Communication Services
- Consumer Discretionary
- Consumer Staples
- Energy
- Financials
- Health Care
- Industrials
- Information Technology
- Materials
- Real Estate
- Utilities
However, drilling down further, there are 24 defined industry groups, 69 industries, and 158 sub-industries.
A sub-sector can be anything that falls within a main GICS sector, so a sub-sector can either be an industry group, industry, or sub-industry for the purposes of this article.
Trending sub-sectors thus far in 2022
Oil & Natural Gas
Within Energy, Oil, and Natural Gas ETFs have performed exceptionally well. With the top performance YTD belonging to various oil and natural gas funds such as:
- UGA (United States Gasoline Fund) +71.9% YTD
- BNO (United States Brent Oil Fund) +60.1% YTD
- UNG (United States Natural Gas Fund) +57.1% YTD
- DBE (Invesco DB Energy Fund) +55.8% YTD
- USO (United States Oil Fund) +50.9% YTD
Metals & Mining
Along with energy commodities such as oil and natural gas, other commodities have also performed quite well this year. An example of this is the strong performance by mining companies. Mining companies fall within the Materials sector, and some examples of mining ETFs are:
- XME (SPDR S&P Metals & Mining ETF) -6.9% YTD
- PICK (iShares MSCI Global Metals & Mining Producers ETF) -17.5% YTD
- REMX (VanEck Rare Earth/Strategic Metals ETF) -25.7% YTD
Agriculture Producers
With Russia’s invasion of Ukraine, there is a global crisis of fertilizer that has increased the importance of agricultural production as the world faces a potential food shortage, especially in developing markets. Therefore, another trending sub-sector includes companies which are involved in the production of agriculture. Some example of agriculture ETFs include:
- DBA (Invesco DB Agriculture Fund) -1.0% YTD
- RJA (Elements Rogers International Commodity Index-Agriculture Total Return ETN) +1.7% YTD
- FAAR (First Trust Alternative Absolute Return Strategy ETF) +12.4% YTD
- WEAT (Teucrium Wheat Fund) +11.7% YTD
Pharmaceuticals
This year has seen a broad-based sell off in high growth sectors such as technology. However, more stable sectors that have inelastic demand for their products are able to outperform in these conditions. This includes the subsector of pharmaceutical companies. Some examples of Pharmaceutical ETFs include:
- PPH (VanEck Pharmaceutical ETF) +0.8% YTD
- IHE (iShares U.S. Pharmaceuticals ETF) -2.3% YTD
- PJP (Invesco Dynamic Pharmaceuticals ETF) -4.8% YTD
Insurance
Within the Financials sector, the insurance industry benefits from rising rates and relatively inelastic demand, especially in the property & casualty insurance space. Some examples of Insurance ETFs include:
- KIE (SPDR S&P Insurance ETF) -4.9% YTD
- IAK (iShares U.S. Insurance ETF) -0.1% YTD
- KBWP (Invesco KBW Property & Casualty Insurance ETF) +2.5% YTD
Data for this article is as of July 5th, 2022.
Mentioned ETFs

Latest ETF News
See all ETF newsMoneyShow Chart of the Day 9/4/26: Don't Just Watch Oil. Watch THESE.


Chart of the Day 8/14/26: The Great "Hot Money" Migration

MoneyShow Chart of the Day 7/29/26: Now, THAT's What I Call Market Rotation!

MoneyShow Chart of the Day 7/16/26: Good News/Bad News on Inflation (and the Fed)



 Advantages of ETFs over Mutual Funds1/6
Lower Costs
In this guide, we'll explore the advantages of ETFs over mutual funds, giving you valuable insights into why ETFs have gained significant popularity among investors like yourself.
Leveraged ETFs: Unlocking the Potential for Amplified Returns1/6
Understanding Leveraged ETFs
Explore leveraged ETFs: potential for amplified returns & risks. 5 ETFs to consider across equities, commodities & fixed income.
What is a Leveraged ETF?1/6
Introducing Leveraged and Inverse ETFs
In this guide, we'll dive into the world of leveraged ETFs, exploring their definition, mechanics, potential risks, and rewards.
Recent educational content

ETF Trends
ETF Industry KPIs September 8, 2026
This week’s KPI data overview highlights key metrics and trends shaping the ETF landscape.

ETF Trends
ETF Industry KPIs August 31, 2026
This week’s KPI data overview highlights key metrics and trends shaping the ETF landscape.
ETF Trends
ETF Industry KPIs August 24, 2026
This week’s KPI data overview highlights key metrics and trends shaping the ETF landscape.
What’sTheFund
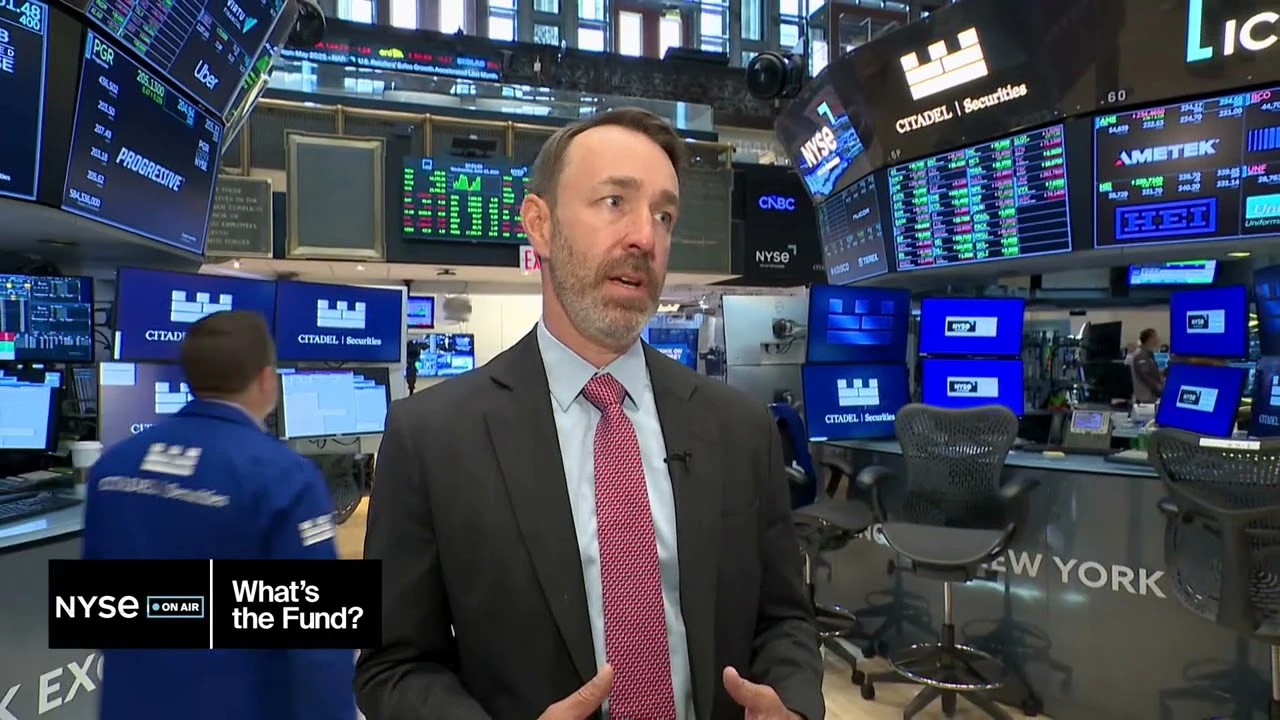
What's the Fund | Ocean Park Diversified Income ETF (DUKZ)
James St Aubin, Chief Investment Officer at Ocean Park Asset Management, discuss the DUKZ ETF, exposing investors to the whole spectrum of asset classes in the fixed income markets, through their rules-based process.

Browse all educational columns



Expert-Built ETF Portfolios, All in One Place
Don’t start from scratch. Discover ready-made ETF portfolios built by professionals to match different goals, timelines, and market views. Use them as inspiration or as a starting point for your own allocation.