Ready-made ETF portfolios built for real investor needs. Explore now →



This Unique ETF Lets You Invest Based on the Shiller CAPE Index
Concerned about record high valuations in certain U.S. sectors? This ETF offers a solution.


Keep up with what matters in ETFs
Get timely ETF insights, market trends, and top ideas straight to your inbox.
Your newsletter subscriptions with us are subject to ETF Central's Privacy Policy and Terms and Conditions.
The versatility of ETFs has revolutionized the way we approach equity investing, offering the flexibility to execute almost any strategy imaginable.
Gone are the days of being limited to straightforward, long-only positions in broad market indices. Today's ETF landscape includes a variety of approaches, from long-short strategies to sector rotation, accommodating the diverse preferences of investors.
One ETF that has recently garnered attention is the unique Shiller CAPE U.S. Equities ETF (CAPE). For me, interest in this ETF stemmed from the current landscape of U.S. equity valuations, which are characterized by significant divergence across different sectors.
For instance, the energy sector presents relatively modest valuations, with a forward price-to-earnings (P/E) ratio of just 9.52, a price-to-sales (P/S) ratio of 0.94, and a price-to-book (P/B) ratio of 1.7. In contrast, the technology sector, buoyed by enthusiasm around artificial intelligence and semiconductor performance, commands much higher valuations, with figures standing at 25.23, 5.85, and 8.6, respectively.
For investors inclined towards investing in sectors that are currently out of favor, yet seeking a methodical approach to doing so, CAPE offers an appealing solution.
This ETF leverages the Shiller CAPE Index methodology, providing a strategic way to identify and invest in undervalued sectors based on robust economic indicators and valuation metrics.
Here's a closer look at how CAPE operates and why it's an ETF worth watching for those looking to navigate the complexities of sector-based investing with a scientific edge.
Like what you're reading?
Stay in the loop — get the latest ETF insights: trends, analysis, and expert picks.
What is the Shiller CAPE?
The Cyclically Adjusted P/E (CAPE) ratio, known as the Shiller P/E ratio or P/E 10, offers a long-term perspective on market valuations by averaging out the fluctuations typically seen in corporate earnings. This metric involves examining the S&P 500's annual earnings over the past ten years, adjusting each year's earnings for inflation to reflect them in today's dollars. These inflation-adjusted figures are then averaged to calculate an adjusted mean earnings figure, referred to as e10. The current price of the S&P 500 is divided by this e10 value to determine the Shiller P/E Ratio.
The Shiller P/E is crucial for investors as it acts as a "canary in the coal mine," providing early warnings of market overvaluations or undervaluations. Comparing current valuations to historical averages helps gauge whether the market is priced high or low relative to its long-term earnings power.
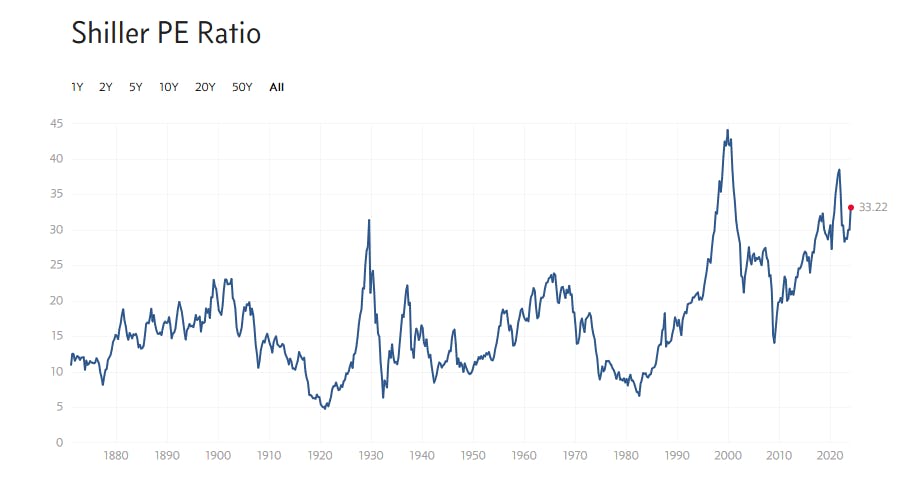
As of February 13, the Shiller P/E ratio for the S&P 500 stands at 33.22, significantly higher than the historical mean of 17.09 and median of 15.96. This suggests that the market is currently valued above its long-term earnings trend.
Historical context shows that the ratio has ranged from a low of 4.78 in December 1920 to a high of 44.19 in December 1999. Interpreting these figures, a Shiller P/E ratio of 33.22 indicates that the market may be overvalued, reflecting heightened investor optimism that might not be fully justified by underlying earnings trends.
How the CAPE ETF works
The Shiller PE (P/E) ratio, while indicating that the market as a whole might be overvalued relative to long-term earnings, doesn't apply uniformly across all sectors. Some sectors, like energy, currently show more modest valuations, highlighting the market's uneven landscape.
CAPE capitalizes on this discrepancy through a sector rotation strategy, selectively investing in the four most undervalued sectors among U.S. large-cap stocks. This approach is refined using modified CAPE ratios to identify sectors that offer the best value relative to their historical earnings.
An essential component of CAPE's strategy is the implementation of a momentum screener. This step is crucial for avoiding value traps—stocks that appear cheap based on traditional metrics but are priced low for a reason, often due to fundamental issues within the company or industry that might not resolve favorably. These stocks can lure investors looking for bargains, only to result in further declining prices.
The momentum screener helps mitigate this risk by ensuring that the ETF invests in undervalued sectors that also show positive price momentum, steering clear of the proverbial falling knife and aiming for sectors that are not only cheap but also poised for a rebound.
CAPE currently encompasses 221 stocks, operating with a 0.65% expense ratio. Notably, this ETF is semi-transparent, meaning it does not disclose its portfolio daily. This design choice is intentional and aimed at protecting the ETF's proprietary investment strategy from potential front-running or mimicry by other investors or funds.
Please note this article is for information purposes only and does not in any way constitute investment advice. It is essential that you seek advice from a registered financial professional prior to making any investment decision.

Latest ETF News
See all ETF newsCould Water ETFs Be the Next AI Bottleneck Trade?

What is a Boomer Candy ETF?

ETF Comparison: NEOS Nasdaq-100 High Income ETF (QQQI) Versus Goldman Sachs Nasdaq-100 Premium Income ETF (GPIQ)





 Advantages of ETFs over Mutual Funds1/6
Lower Costs
In this guide, we'll explore the advantages of ETFs over mutual funds, giving you valuable insights into why ETFs have gained significant popularity among investors like yourself.
Leveraged ETFs: Unlocking the Potential for Amplified Returns1/6
Understanding Leveraged ETFs
Explore leveraged ETFs: potential for amplified returns & risks. 5 ETFs to consider across equities, commodities & fixed income.
What is a Leveraged ETF?1/6
Introducing Leveraged and Inverse ETFs
In this guide, we'll dive into the world of leveraged ETFs, exploring their definition, mechanics, potential risks, and rewards.
Recent educational content

ETF Trends
ETF Industry KPIs September 8, 2026
This week’s KPI data overview highlights key metrics and trends shaping the ETF landscape.

ETF Trends
ETF Industry KPIs August 31, 2026
This week’s KPI data overview highlights key metrics and trends shaping the ETF landscape.
ETF Trends
ETF Industry KPIs August 24, 2026
This week’s KPI data overview highlights key metrics and trends shaping the ETF landscape.

What’sTheFund
What's the Fund | Ocean Park Diversified Income ETF (DUKZ)
James St Aubin, Chief Investment Officer at Ocean Park Asset Management, discuss the DUKZ ETF, exposing investors to the whole spectrum of asset classes in the fixed income markets, through their rules-based process.

Browse all educational columns



Expert-Built ETF Portfolios, All in One Place
Don’t start from scratch. Discover ready-made ETF portfolios built by professionals to match different goals, timelines, and market views. Use them as inspiration or as a starting point for your own allocation.