Keep tabs on your favorite ETFs with a personalized weekly tracker. Create a Watchlist now →



The Weekly ETF Market Monitor (September 14-18, 2026)
A comprehensive snapshot of U.S. ETF market activity in Week 38 (September 14-18, 2026), spanning flows, performance, sector and thematic trends, geographic exposures, asset classes, and leading funds and issuers.

Keep up with what matters in ETFs
Get timely ETF insights, market trends, and top ideas straight to your inbox.
Your newsletter subscriptions with us are subject to ETF Central's Privacy Policy and Terms and Conditions.
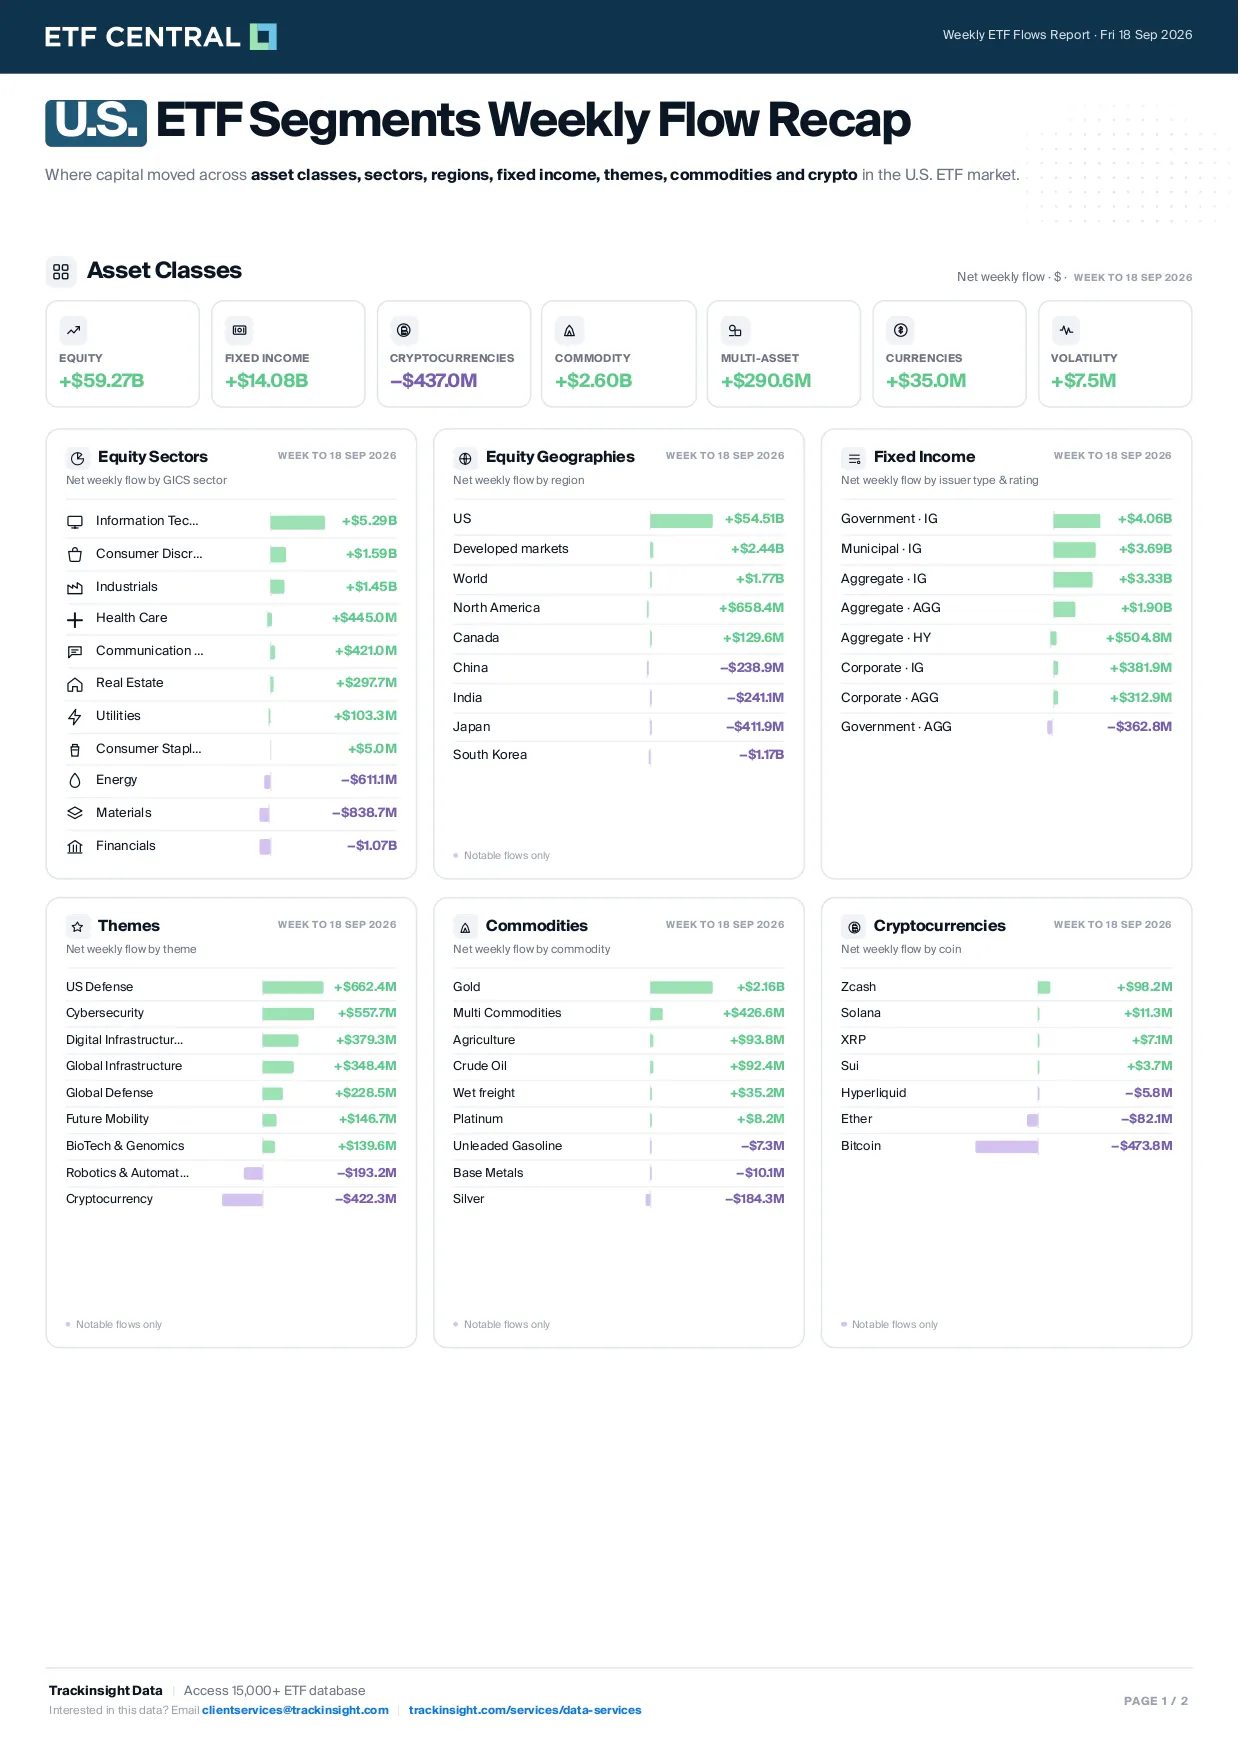
According to data by Trackinsight, U.S.-listed ETFs recorded strong inflows during the week ending September 18, with equity ETFs attracting $59.27 billion and fixed income ETFs gathering $14.08 billion. Commodities added $2.60 billion, while cryptocurrency products recorded $437.0 million in net outflows.
Information Technology led sector ETF inflows with $5.29 billion, followed by Consumer Discretionary ($1.59B) and Industrials ($1.45B). Financials recorded the largest sector outflow at $1.07 billion, followed by Materials ($838.7M) and Energy ($611.1M).
U.S.-focused equity ETFs dominated geographic flows with $54.51 billion, followed by Developed Markets ($2.44B) and World exposures ($1.77B). South Korea recorded the largest geographic outflow at $1.17 billion.
U.S. Defense topped thematic inflows with $662.4 million, followed by Cybersecurity ($557.7M), Digital Infrastructure & Connectivity ($379.3M) and Global Infrastructure ($348.4M).
Cryptocurrency themes recorded the largest thematic outflow at $422.3 million.
Government Investment Grade ETFs led fixed income flows with $4.06 billion, followed by Municipal Investment Grade ($3.69B) and Aggregate Investment Grade ($3.33B).
Gold led commodity inflows with $2.16 billion, while Silver recorded $184.3 million in outflows. In cryptocurrencies, Zcash attracted $98.2 million, while Bitcoin recorded the largest outflow at $473.8 million.
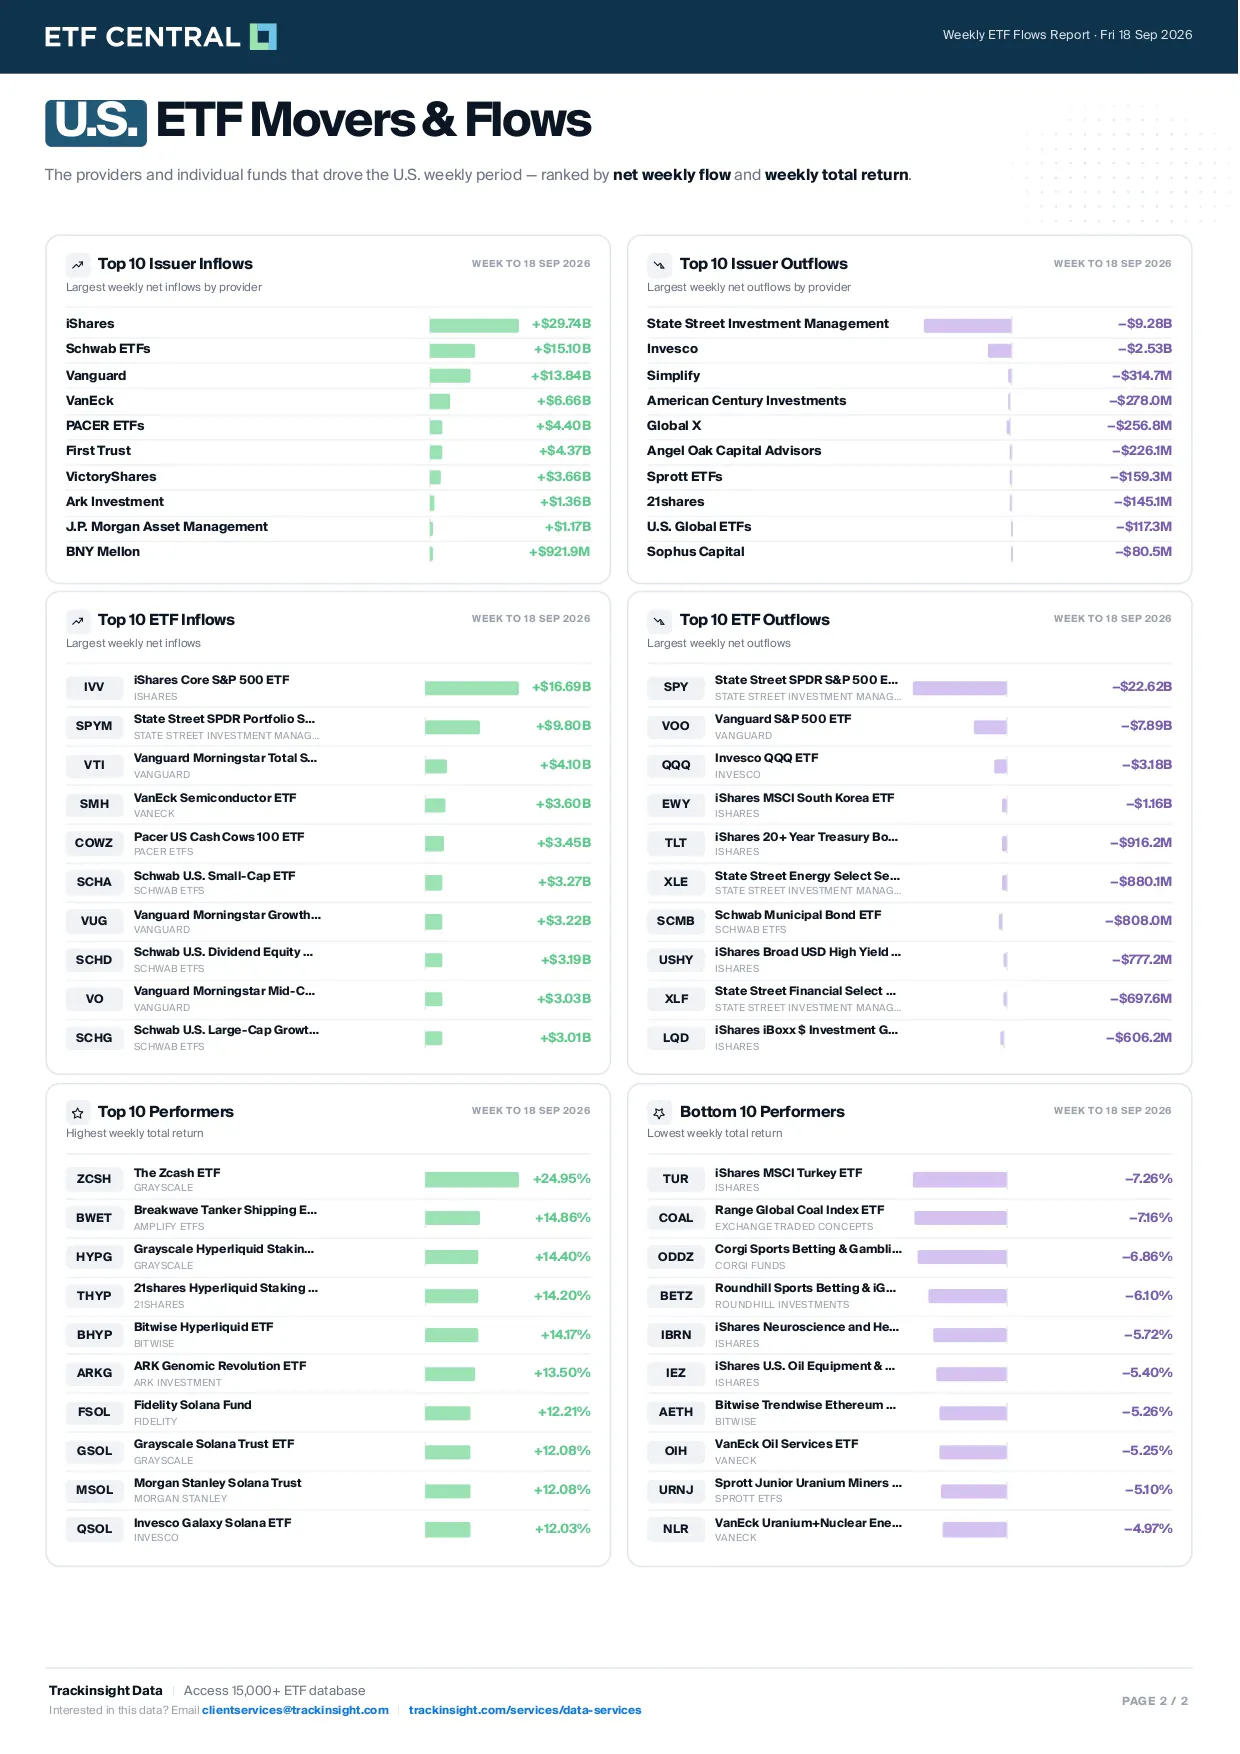
At the fund level, iShares led issuers with $29.74 billion in net inflows, followed by Schwab ETFs ($15.10B), Vanguard ($13.84B), VanEck ($6.66B) and PACER ETFs ($4.40B).
At the fund level, the iShares Core S&P 500 ETF (IVV) topped inflows with $16.69 billion, followed by the State Street SPDR Portfolio S&P 500 ETF (SPYM) with $9.80 billion and the Vanguard Total Stock Market ETF (VTI) with $4.10 billion.
The State Street SPDR S&P 500 ETF Trust (SPY) recorded the largest outflow at $22.62 billion, followed by the Vanguard S&P 500 ETF (VOO) at $7.89 billion and the Invesco QQQ ETF (QQQ) at $3.18 billion.
The Zcash ETF (ZCSH) led weekly performance with a 24.95% gain, followed by the Breakwave Tanker Shipping ETF (BWET) at 14.86% and the Grayscale Hyperliquid Staking ETF (HYPG) at 14.40%.
At the bottom of the rankings, the iShares MSCI Turkey ETF (TUR) fell 7.26%, followed by the Range Global Coal Index ETF (COAL) at -7.16% and the Corgi Sports Betting & Gambling ETF (ODDZ) at -6.86%.
Like what you're reading?
Stay in the loop — get the latest ETF insights: trends, analysis, and expert picks.
About Trackinsight
Trackinsight is a global ETF data, analytics, research, and advisory firm serving professional investors, financial advisors, and institutions. Founded in 2016 and headquartered in Biot, France, the company operates across six countries and serves thousands of investment professionals. Since 2024, Trackinsight has been majority-owned by Kepler Cheuvreux and is part of ETF One, its integrated platform combining ETF Data Services, Research & Advisory, and Execution.
Please note that this article was generated using artificial intelligence based on Trackinsight data and is provided for informational purposes only. AI-generated content may contain errors, omissions, inaccuracies, or fabricated information and should not be relied upon without independent verification. Nothing in this article constitutes investment, financial, legal, or other professional advice. Investors should conduct their own due diligence and consult a qualified financial professional before making any investment decision.

Latest ETF News
See all ETF newsETF News You Missed This Week - September 14 - 18, 2026

The Weekly ETF Market Monitor (September 7-11, 2026)
ETF News You Missed This Week - September 7 - 11, 2026

The Weekly ETF Market Monitor (August 31- September 4, 2026)
ETF News You Missed This Week - August 31 - September 4, 2026

The Weekly ETF Market Monitor (August 24-28, 2026)

 Advantages of ETFs over Mutual Funds1/6
Lower Costs
In this guide, we'll explore the advantages of ETFs over mutual funds, giving you valuable insights into why ETFs have gained significant popularity among investors like yourself.
Leveraged ETFs: Unlocking the Potential for Amplified Returns1/6
Understanding Leveraged ETFs
Explore leveraged ETFs: potential for amplified returns & risks. 5 ETFs to consider across equities, commodities & fixed income.
What is a Leveraged ETF?1/6
Introducing Leveraged and Inverse ETFs
In this guide, we'll dive into the world of leveraged ETFs, exploring their definition, mechanics, potential risks, and rewards.
Recent educational content

ETF Trends
ETF Industry KPIs September 14, 2026
This week’s KPI data overview highlights key metrics and trends shaping the ETF landscape.

ETF Trends
ETF Industry KPIs September 8, 2026
This week’s KPI data overview highlights key metrics and trends shaping the ETF landscape.
ETF Trends
ETF Industry KPIs August 31, 2026
This week’s KPI data overview highlights key metrics and trends shaping the ETF landscape.
ETF Trends
ETF Industry KPIs August 24, 2026
This week’s KPI data overview highlights key metrics and trends shaping the ETF landscape.
Browse all educational columns



Build and Analyze Your ETF Portfolio Like a Pro
Create your own ETF portfolio in minutes and instantly see allocations, exposures, performance, and risk. Visualize diversification across asset classes, regions, and sectors. Stress-test ideas, compare benchmarks, and refine your strategy with professional-grade analytics.
