Ready-made ETF portfolios built for real investor needs. Explore now →



The Weekly ETF Market Monitor (August 24-28, 2026)
A comprehensive snapshot of U.S. ETF market activity in Week 35 (August 24-28, 2026), spanning flows, performance, sector and thematic trends, geographic exposures, asset classes, and leading funds and issuers.

Keep up with what matters in ETFs
Get timely ETF insights, market trends, and top ideas straight to your inbox.
Your newsletter subscriptions with us are subject to ETF Central's Privacy Policy and Terms and Conditions.
According to data by Trackinsight, Equity ETFs attracted $13.24 billion during the week to August 28, the largest allocation across asset classes. Fixed Income ETFs followed with $10.77 billion, while Cryptocurrencies gathered $2.88 billion. Commodity products added $967.2 million and Multi-Asset ETFs attracted $346.3 million.
Get data on 14,000+ ETFs
Access Trackinsight's reliable and comprehensive data with 500M+ points on 14,000+ ETFs.
Sector Flows: Information Technology Leads, Financials See Largest Outflow
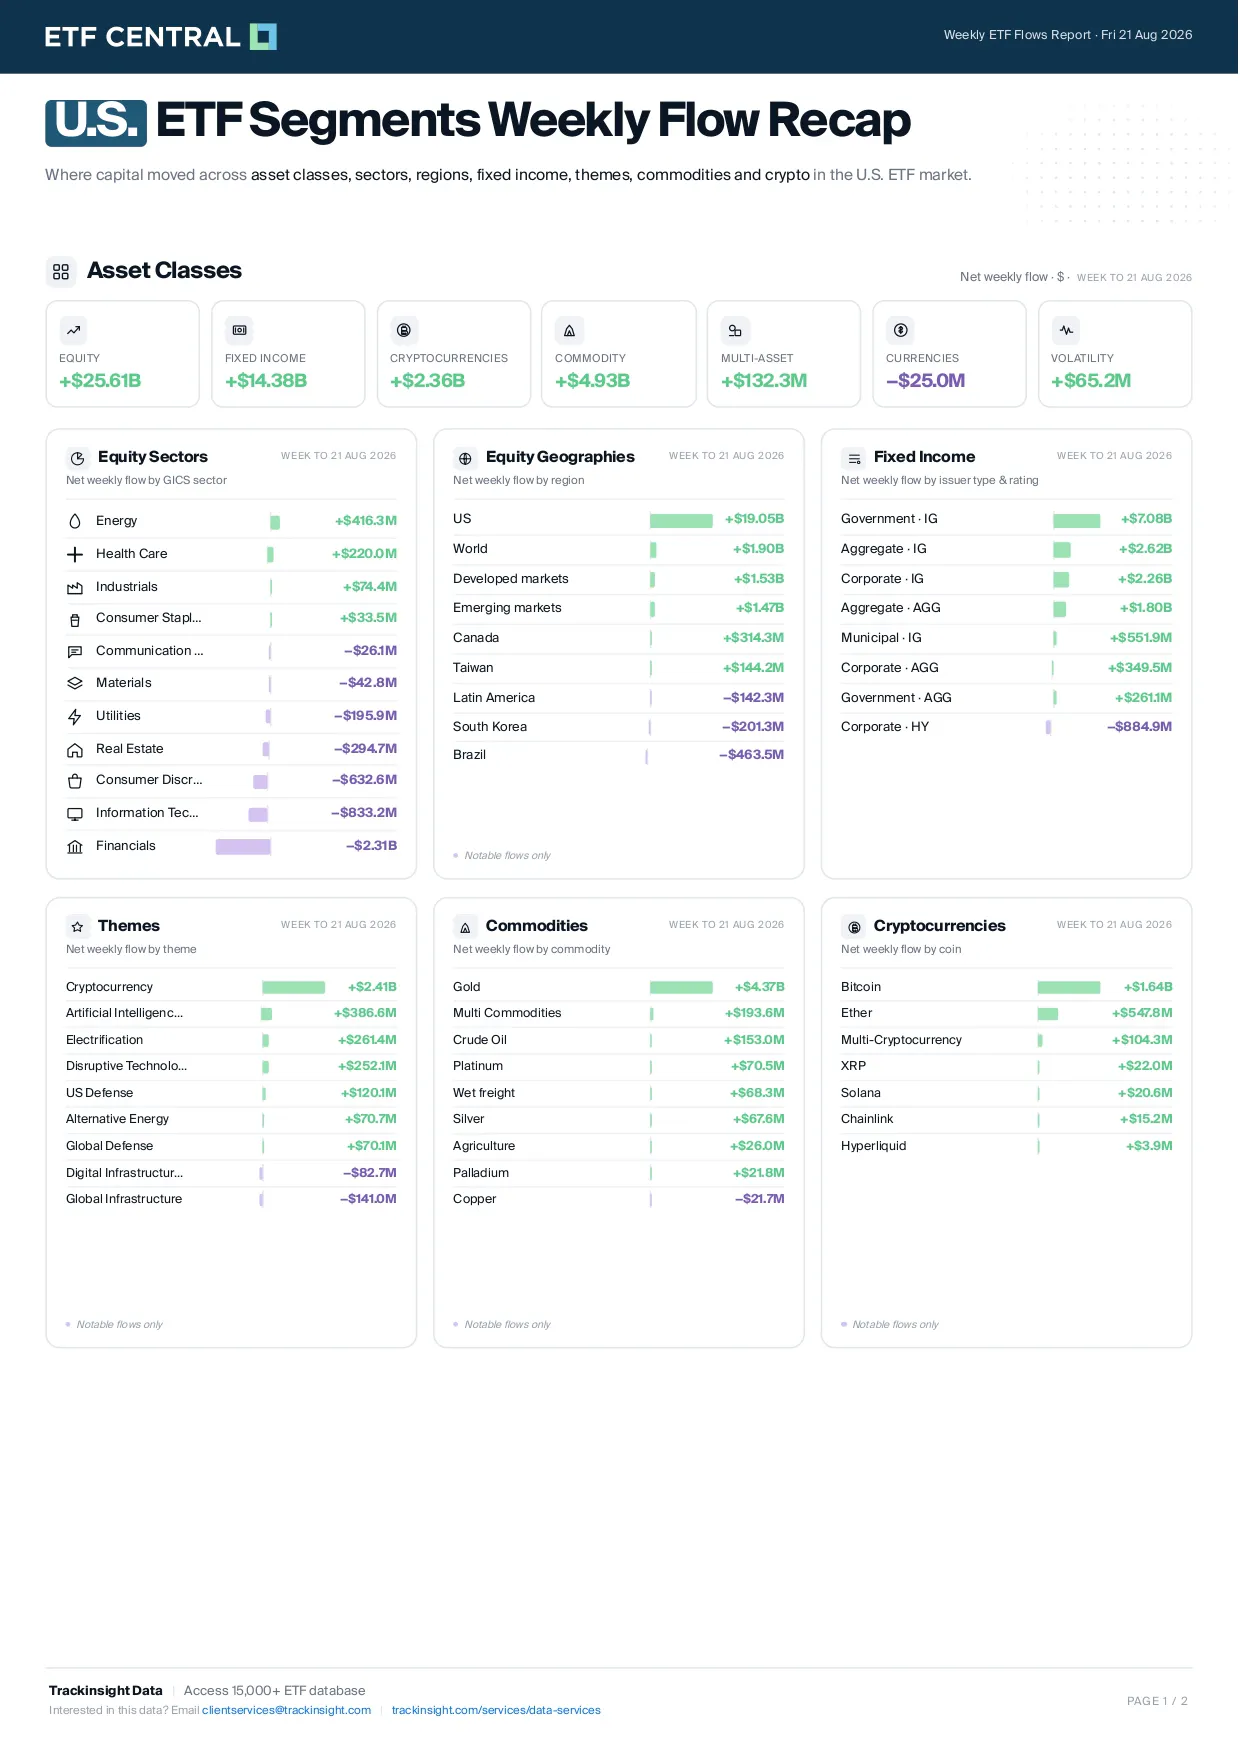
Among equity sectors, Information Technology led with $1.54 billion in weekly inflows. Consumer Discretionary and Health Care followed with $310.2 million and $308.4 million respectively.
At the other end, Financials recorded the largest sector outflow at $1.99 billion, while Energy lost $438.7 million and Industrials declined by $357.8 million.
Geographic Flows: US-Focused ETFs Dominate
US-focused ETFs attracted $6.15 billion, ahead of Developed Markets at $2.71 billion and World exposures at $2.24 billion. Emerging Markets added $1.34 billion, while South Korea recorded a $409.5 million outflow among the notable geographic movements shown.
Fixed Income, Gold and Bitcoin Lead Their Segments
Fixed income flows were led by Government Investment Grade, which gathered $3.30 billion, followed by Aggregate Investment Grade at $2.99 billion.
Elsewhere, Cryptocurrency themes attracted $2.95 billion, Gold led commodity flows with $753.1 million, and Bitcoin topped cryptocurrency flows with $1.36 billion.
ETF Flows: VOO Leads Inflows While SPY Posts Largest Outflow
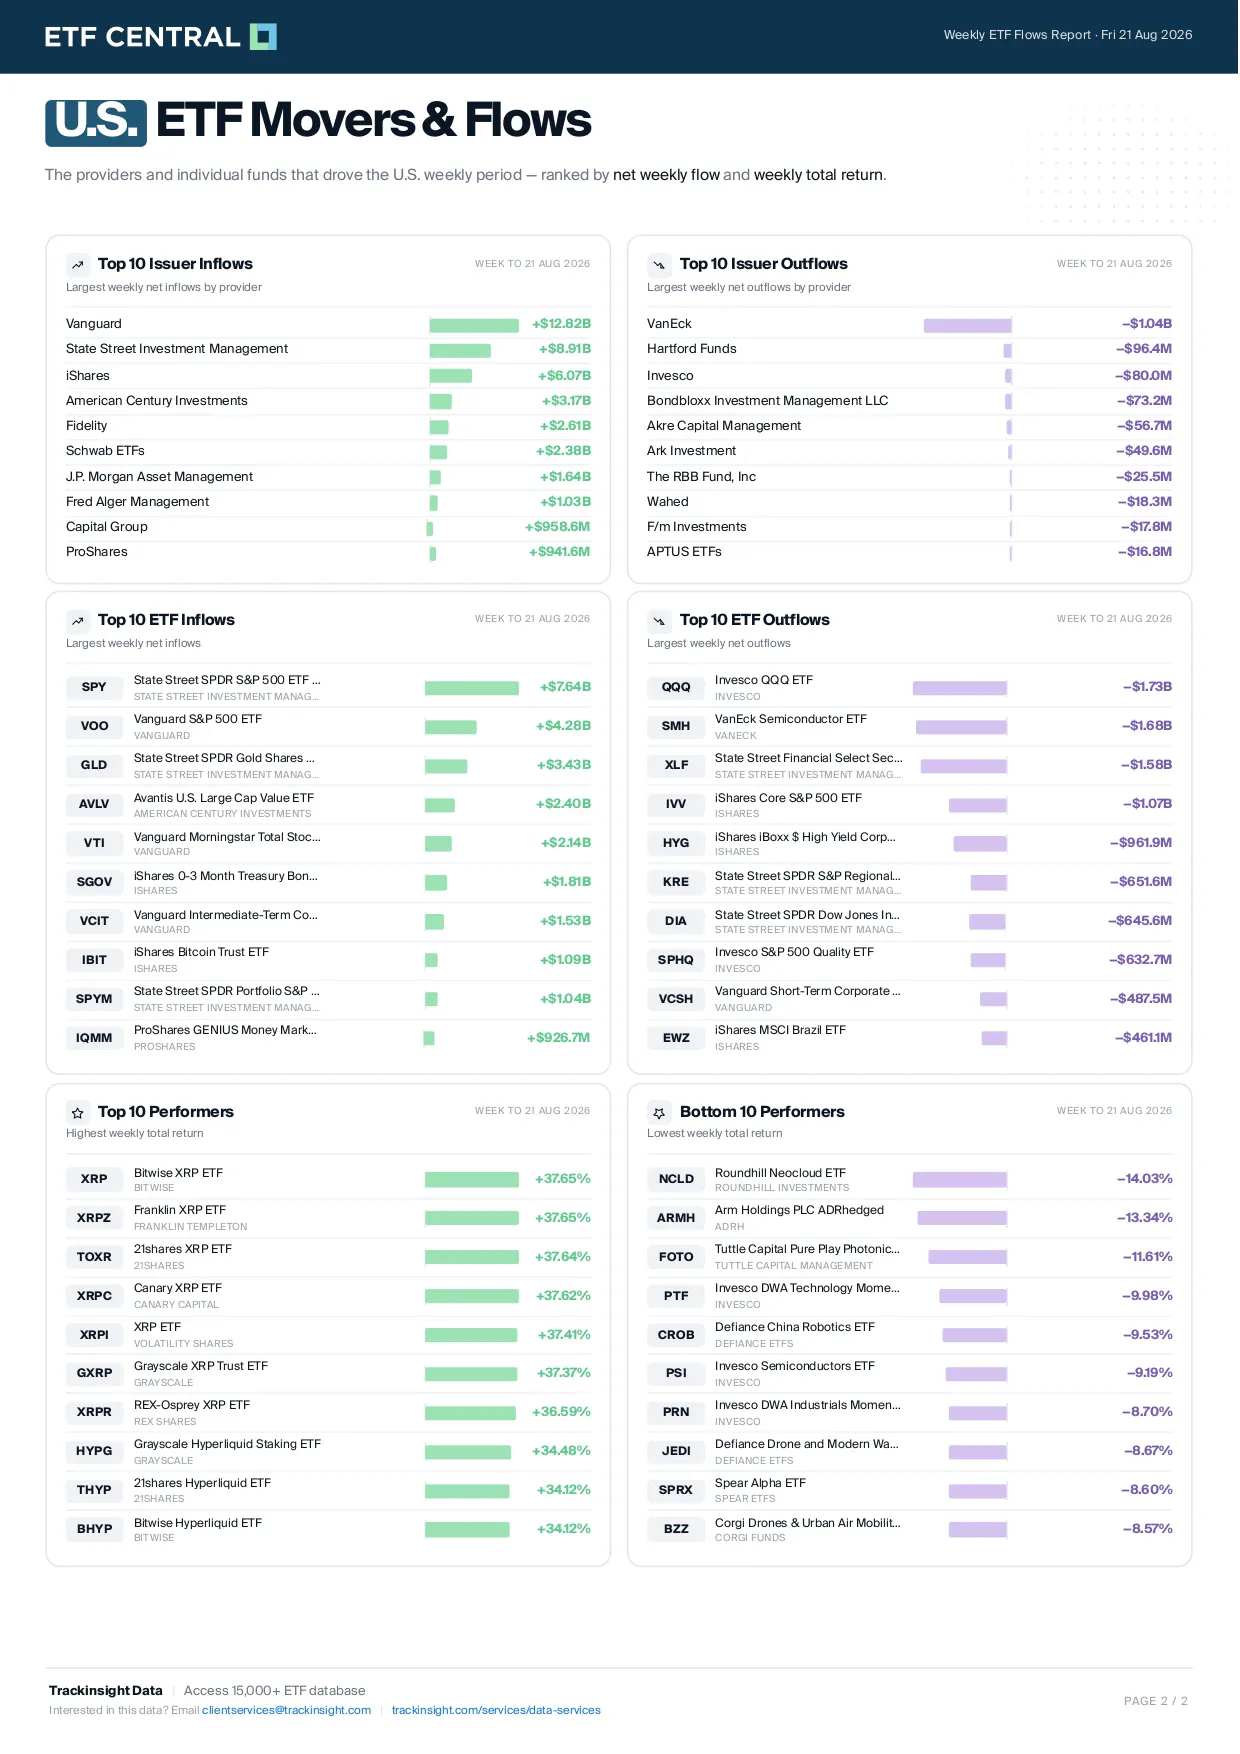
At the individual-fund level, Vanguard S&P 500 ETF (VOO) led weekly inflows with $11.36 billion. It was followed by Vanguard Short-Term Treasury ETF (VGSH) at $3.67 billion, Vanguard Morningstar Total Stock Market ETF (VTI) at $2.39 billion, Schwab Short-Term U.S. Treasury ETF (SCHO) at $1.75 billion, and VanEck Semiconductor ETF (SMH) at $1.68 billion.
On the outflow side, State Street SPDR S&P 500 ETF (SPY) recorded the largest weekly withdrawal at $9.76 billion, narrowly ahead of iShares Core S&P 500 ETF (IVV) at $9.56 billion. Vanguard Intermediate-Term Government Bond ETF (VGIT) lost $2.64 billion, iShares U.S. Treasury Bond ETF (GOVT) recorded $2.63 billion in outflows, and State Street Financial Select Sector SPDR ETF (XLF) declined by $1.80 billion.
ETF Performance: Solana Products Lead Weekly Gains
Solana-linked products occupied the top of the weekly performance rankings. REX-Osprey SOL + Staking ETF (SSK) led with a 14.06% gain, followed by Grayscale Solana Trust ETF (GSOL) at 13.82%, Invesco Galaxy Solana ETF (QSOL) at 13.74%, Bitwise Solana Staking ETF (BSOL) at 13.71%, and Fidelity Solana Fund (FSOL) at 13.69%.
At the bottom of the performance table, Defiance Pure Quantum ETF (QTUP) declined 11.33%, followed by Corgi Quantum Computing ETF (CQTM) at -9.38%, Breakwave Tanker Shipping ETF (BWET) at -8.54%, Grayscale Sui Staking ETF (GSUI) at -8.26%, and Stellar ETF (STLR) at -7.77%.
About Trackinsight
Trackinsight is a global ETF data, analytics, research, and advisory firm serving professional investors, financial advisors, and institutions. Founded in 2016 and headquartered in Biot, France, the company operates across six countries and serves thousands of investment professionals. Since 2024, Trackinsight has been majority-owned by Kepler Cheuvreux and is part of ETF One, its integrated platform combining ETF Data Services, Research & Advisory, and Execution.
Please note this article is for information purposes only and does not in any way constitute investment advice. It is essential that you seek advice from a registered financial professional prior to making any investment decision.
Topics
See all
This article does not have a tagged topic
Segments
See all
No specific market segments were tagged
Mentioned ETFs
Further reading


Latest ETF News
See all ETF newsThe Weekly ETF Market Monitor (October 5-9, 2026)
ETF News You Missed This Week - October 5-9, 2026


The Weekly ETF Market Monitor (September 21-25, 2026)
ETF News You Missed This Week - September 21 - 25, 2026


 Advantages of ETFs over Mutual Funds1/6
Lower Costs
In this guide, we'll explore the advantages of ETFs over mutual funds, giving you valuable insights into why ETFs have gained significant popularity among investors like yourself.
Leveraged ETFs: Unlocking the Potential for Amplified Returns1/6
Understanding Leveraged ETFs
Explore leveraged ETFs: potential for amplified returns & risks. 5 ETFs to consider across equities, commodities & fixed income.
What is a Leveraged ETF?1/6
Introducing Leveraged and Inverse ETFs
In this guide, we'll dive into the world of leveraged ETFs, exploring their definition, mechanics, potential risks, and rewards.
Recent educational content

ETF Trends
ETF Industry KPIs October 5, 2026
This week’s KPI data overview highlights key metrics and trends shaping the ETF landscape.

ETF Trends
ETF Industry KPIs September 28, 2026
This week’s KPI data overview highlights key metrics and trends shaping the ETF landscape.
ETF Trends
ETF Industry KPIs September 22, 2026
This week’s KPI data overview highlights key metrics and trends shaping the ETF landscape.

First Look ETF
First Look ETF: Income, Corporate Arbitrage, and Growth and Value Investing
First Look ETF September 2026: iCapital, Mast Investments and North Square unpack new ETFs targeting monthly income, merger arbitrage and complementary growth and value exposure.

Browse all educational columns



Build and Analyze Your ETF Portfolio Like a Pro
Create your own ETF portfolio in minutes and instantly see allocations, exposures, performance, and risk. Visualize diversification across asset classes, regions, and sectors. Stress-test ideas, compare benchmarks, and refine your strategy with professional-grade analytics.
