NYSE CRTR Economy Event Watch the replay →

S&P 500 vs NASDAQ 100 ETFs: A comparison
Both indexes are highly popular with U.S. investors. Here's how they stack up head-to-head.


Keep up with what matters in ETFs
Get timely ETF insights, market trends, and top ideas straight to your inbox.
Your newsletter subscriptions with us are subject to ETF Central's Privacy Policy and Terms and Conditions.
Two of the most popular ETFs by assets under management (AUM) with U.S. investors are the SPDR S&P 500 ETF (
- Miniscule bid-ask spreads;
- High daily volumes;
- Well-developed options chains;
These features make them a top choice for institutional and retail investors alike. However, while both track large-cap U.S. equities, there are a few differences worth exploring, especially for investors considering either as a potential long-term portfolio holding.
Get data on 14,000+ ETFs
Access Trackinsight's reliable and comprehensive data with 500M+ points on 14,000+ ETFs.
Differences in Holdings
As noted earlier, both ETFs track large-cap U.S equities, but with a few key differences:
- The S&P 500 holds 500 stocks listed on all U.S. exchanges, while the NASDAQ 100 holds 101 stocks listed only on the NASDAQ exchange.
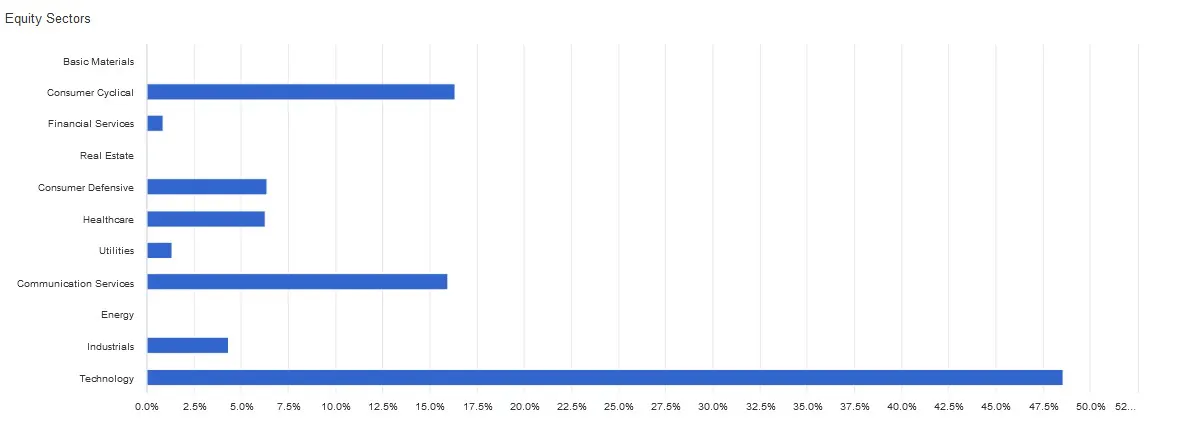
- The S&P 500 holds stocks from all 11 sectors (Information Technology, Health Care, Financials, Consumer Discretionary, Communication Services, Industrials, Consumer Staples, Energy, Utilities, Real Estate, and Materials), while the NASDAQ 100 specifically excludes financial stocks, but is much more heavily weighted towards technology.
S&P 500 Holdings:

NASDAQ 100 Holdings:
Differences in Style
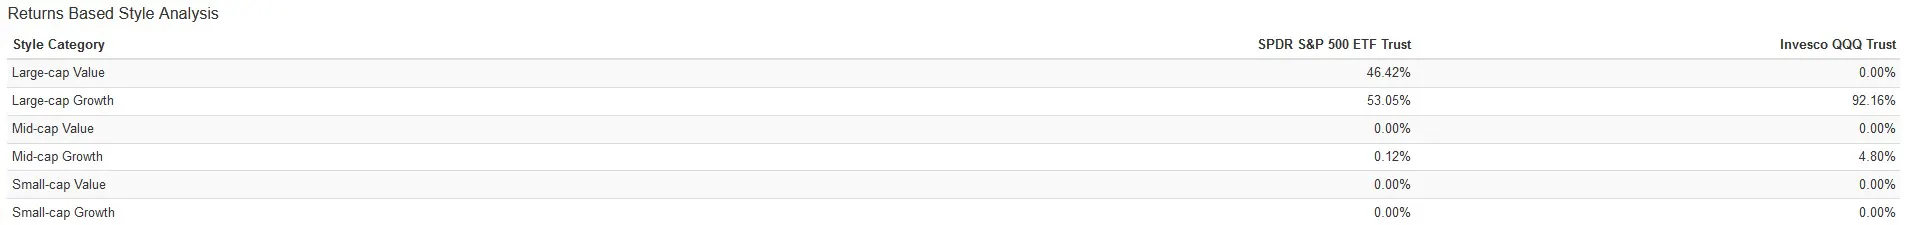
The stocks contained in each index also differ in terms of style (growth vs value, small vs large-cap, or blend):
- The S&P 500 is weighted towards a "blended" approach (an even mix of value vs growth stocks) while the NASDAQ 100 is heavily skewed towards growth stocks.
- The S&P 500 comprises mostly large-caps (84%) with some mid-caps (16%), while the NASDAQ 100 is composed of 93% large-caps and 7% mid-caps.
Differences in Top Holdings
Both funds tend to be highly correlated in performance due to their overlap in top holdings, which comprise a substantial portion of each ETF's overall weightings.
S&P 500 Top Holdings:
- Apple Inc. 7.33%
- Microsoft Corporation 6.09%
- Amazon.com Inc 3.52%
- Tesla Inc 2.09%
- Alphabet Inc. Class A 2.03%
- Alphabet Inc. Class C 1.88%
- Berkshire Hathaway Inc. Class B 1.50%
- UnitedHealth Group Incorporated 1.42%
- NVIDIA Corporation 1.28%
- Johnson & Johnson 1.27%
NASDAQ 100 Top Holdings:
- Apple Inc 13.39%
- Microsoft Corp 10.57%
- Amazon.com Inc 7.10%
- Tesla Inc 4.47%
- Alphabet Inc 3.70%
- Alphabet Inc 3.52%
- NVIDIA Corp 3.11%
- Meta Platforms Inc 2.99%
- PepsiCo Inc 1.97%
- Costco Wholesale Corp 1.94%
Similar top holdings include Apple, Microsoft, Amazon, Alphabet, Tesla, and NVIDIA, with the NASDAQ 100 giving them higher weights due to its lower number of holdings.
Differences in Historical Performance


From 2000 to the present, both ETFs are neck and neck. Their outperformance relative to the other comes in bursts. Notably, in the years following the Dot-Com Bubble, the NASDAQ 100 suffered much more than the S&P 500. In the low-interest rate bull market between 2011 – 2021, the NASDAQ 100 beat the S&P 500 as its heavier allocation of FAANG stocks helped it outperform. In 2022 when interest rates and inflation ran high, the S&P 500 lost substantially less than the NASDAQ 100.
As of July 2022, the S&P 500 posted better risk-adjusted returns during this period, with a similar CAGR but lower volatility. However, because this backtest is dependent on start and end dates (which wasn’t favorable for the NASDAQ 100 given that it began right during the Dot-Com Bubble), we need to look at rolling returns:

The NASDAQ 100 recorded much better average and high returns over various one, three, five, seven, 10, and 15 year rolling periods. Does this mean it will outperform in the future? Not quite, but this is impressive, nonetheless. Keep in mind however, that this came with high volatility – the NASDAQ 100's lows were much worse than the S&P 500.
What's the verdict?
Are you ready to potentially see QQQ drop over 35% each year for three consecutive years? Can you stick with your choice if you picked SPY only to see QQQ beat it for four years straight? Both of these scenarios have happened before and may happen again over many market cycles. In the end, your decision may boil down to behavioural factors, which for most investors can make-or-break a strategy.
Latest ETF News
See all ETF newsETF Contrarian Corner: Two Unloved Segments That Investors Are Ignoring

The Super El Niño Trade: Two Potential ETF Winners and Losers


The SpaceX (SPCX) IPO: Here's Which ETFs Already Own it


 Advantages of ETFs over Mutual Funds1/6
Lower Costs
In this guide, we'll explore the advantages of ETFs over mutual funds, giving you valuable insights into why ETFs have gained significant popularity among investors like yourself.
Leveraged ETFs: Unlocking the Potential for Amplified Returns1/6
Understanding Leveraged ETFs
Explore leveraged ETFs: potential for amplified returns & risks. 5 ETFs to consider across equities, commodities & fixed income.
What is a Leveraged ETF?1/6
Introducing Leveraged and Inverse ETFs
In this guide, we'll dive into the world of leveraged ETFs, exploring their definition, mechanics, potential risks, and rewards.
Recent educational content

Asset TV
The ETF Show - New Autism-Impact ETF Launched
Defiance ETFs has launched the first ETF, $ASD, focused on the autism ecosystem, investing in companies that provide services, products, and research related to autism and neurodivergence.


ETF Trends
ETF Industry KPIs June 1, 2026
The ETF Industry saw 22 New Launches, 1 Ticker Change and 1 closure last week.
ETF Trends
ETF Industry KPIs May 20, 2026
The ETF Industry saw 44 New Launches, 3 Mutual Fund Conversions and 9 closures last week.

Asset TV
The ETF Show - Politics Becomes Investable Trade through ETFs
Dan Weiskopf, Senior Portfolio Manager at Tidal Financial Group spoke with the ETF Show about Subversive ETFs that help investors trade like politicians.
Browse all educational columns

The ETF Industry Is Evolving Fast
From AI infrastructure to active strategies, the ETF landscape is shifting. Share your perspective in the 7th Annual Global ETF Survey and get exclusive early access to the final report.
