Explore professionally built ETF model portfolios. Discover now →



Securitized Fixed Income: A Proven Performer in Market Downturns
A data-backed look at why securitized fixed income has delivered resilience through five major market corrections.

Keep up with what matters in ETFs
Get timely ETF insights, market trends, and top ideas straight to your inbox.
Your newsletter subscriptions with us are subject to ETF Central's Privacy Policy and Terms and Conditions.
Average peak-to-trough return of the five most-recent equity market corrections/bear markets, with corresponding returns for various fixed income sectors
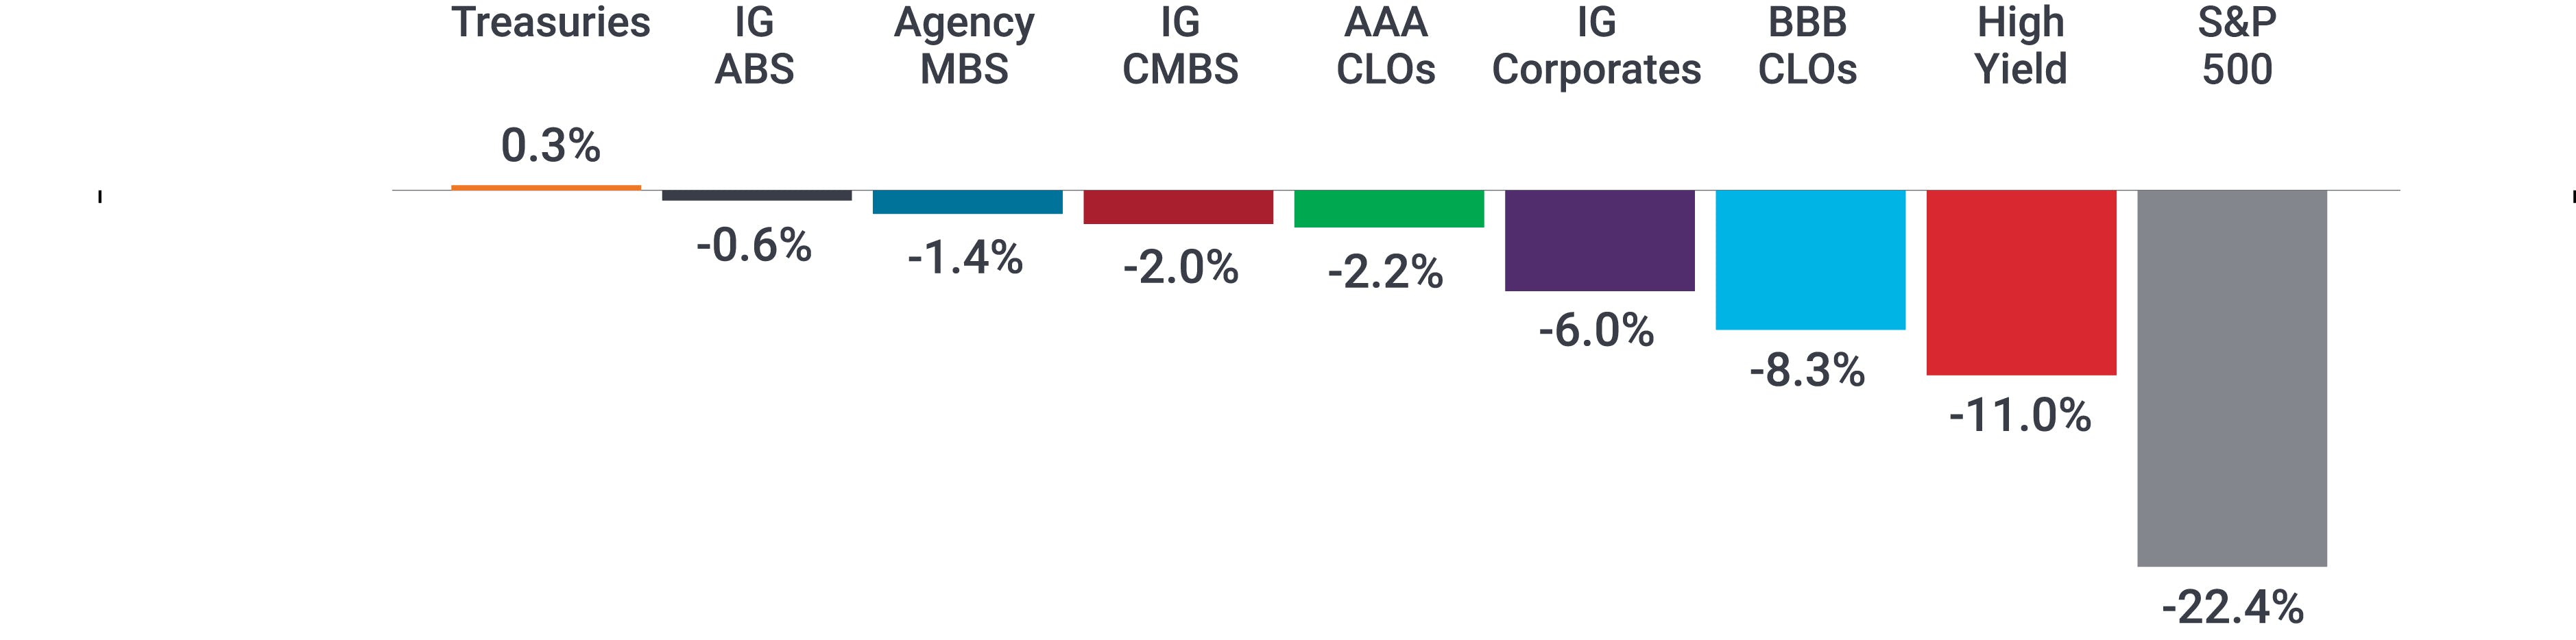
Source: Bloomberg, J.P. Morgan, as of 15 April 2025. Asset class descriptions and indices used to represent asset classes as per footnote.² Returns represent the average peak-to-trough return for the five most recent corrections and bear markets on the S&P 500 Index, with corresponding returns for fixed income sectors over the same period. See the table below for more details. Past performance does not predict future returns.
For investors who are relatively new to securitized fixed income, recent market volatility may have provided the first opportunity to witness how securitized sectors might respond when equity markets pull back.
Like what you're reading?
Stay in the loop — get the latest ETF insights: trends, analysis, and expert picks.
Key takeaways:
- U.S. securitized fixed income has, on average, performed better than corporate bonds through the five most recent corrections and bear markets.¹ Within U.S. fixed income, only Treasuries have outperformed securitized sectors through such periods going back to 2015.
- In our view, the strong performance of securitized sectors is due to the high credit quality, low correlation to equities, and low duration within asset-backed securities (ABS), commercial mortgage-backed securities (CMBS), and collateralized loan obligations (CLOs), while agency MBS have benefitted from their perceived status as a safe-haven asset during bouts of volatility.
- We believe an appropriate allocation to securitized sectors is critical to navigating ongoing economic uncertainty and persistent volatility in equity markets. Because securitized exposure is typically not accessible through static benchmark indices, investors may need to tactically allocate to securitized sectors to increase their exposure.
¹ A market correction is defined as a decline of 10% or more (but less than 20%) from the market’s most recent high. If the decline surpasses 20%, it is defined as a bear market.
Table 1: Peak-to-trough returns of the five most-recent equity market corrections/bear markets, with corresponding returns for various fixed income sectors over the same period
Despite some sensationalized and misleading headlines regarding securitized assets, specifically CLOs, securitized sectors responded to recent events as we would have expected: Returns were mostly flat to slightly positive when equity markets were down almost 20%. The performance of securitized fixed income through the recent market correction is broadly in line with its performance during previous bouts of volatility. This further highlights our belief that an appropriate allocation to U.S. securitized fixed income is a key component of a strategic asset allocation.
Disclaimers and sources:
² U.S. Treasuries = Bloomberg U.S. Treasuries Index, IG ABS = Bloomberg US Aggregate Asset-Backed Securities Index, Agency MBS = Bloomberg U.S. Mortgage-Backed Securities Index, IG CMBS = Bloomberg Investment Grade Commercial Mortgage-Backed Securities Index, AAA CLOs = J.P. Morgan AAA CLO Index, IG corporates = Bloomberg U.S. Corporate Bond Index, BBB CLOs = J.P. Morgan BBB CLO Index, High yield = Bloomberg U.S. Corporate High Yield Bond Index, S&P 500 = S&P 500® Index.
Securitized products, such as mortgage- and asset-backed securities, are more sensitive to interest rate changes, have extension and prepayment risk, and are subject to more credit, valuation and liquidity risk than other fixed-income securities.
Fixed income securities are subject to interest rate, inflation, credit and default risk. The bond market is volatile. As interest rates rise, bond prices usually fall, and vice versa. The return of principal is not guaranteed, and prices may decline if an issuer fails to make timely payments or its credit strength weakens.
Please note that this article reflects the author's personal views and does not represent the opinions of the publication or its affiliates. It is for informational purposes only and does not constitute investment advice. It is essential to seek guidance from a registered financial professional before making any investment decisions.

Latest ETF News
See all ETF newsEntering A New Era of Defense Tech Spending


How SPXD Delivers a More Balanced S&P 500 Exposure


Autocallable Yield Advantage and Market Reception




 Advantages of ETFs over Mutual Funds1/6
Lower Costs
In this guide, we'll explore the advantages of ETFs over mutual funds, giving you valuable insights into why ETFs have gained significant popularity among investors like yourself.
Leveraged ETFs: Unlocking the Potential for Amplified Returns1/6
Understanding Leveraged ETFs
Explore leveraged ETFs: potential for amplified returns & risks. 5 ETFs to consider across equities, commodities & fixed income.
What is a Leveraged ETF?1/6
Introducing Leveraged and Inverse ETFs
In this guide, we'll dive into the world of leveraged ETFs, exploring their definition, mechanics, potential risks, and rewards.
Recent educational content

ETF Trends
ETF Industry KPIs September 8, 2026
This week’s KPI data overview highlights key metrics and trends shaping the ETF landscape.

ETF Trends
ETF Industry KPIs August 31, 2026
This week’s KPI data overview highlights key metrics and trends shaping the ETF landscape.
ETF Trends
ETF Industry KPIs August 24, 2026
This week’s KPI data overview highlights key metrics and trends shaping the ETF landscape.
What’sTheFund
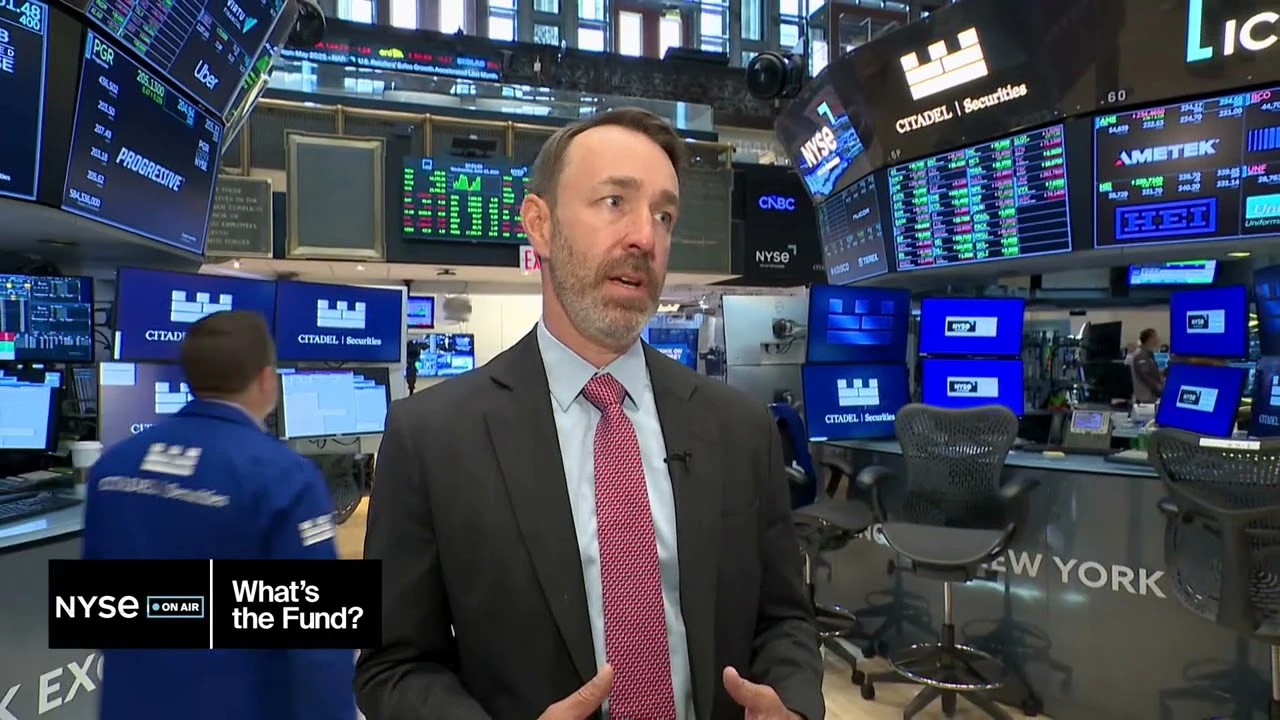
What's the Fund | Ocean Park Diversified Income ETF (DUKZ)
James St Aubin, Chief Investment Officer at Ocean Park Asset Management, discuss the DUKZ ETF, exposing investors to the whole spectrum of asset classes in the fixed income markets, through their rules-based process.

Browse all educational columns



Have you tried our ETF Compare tool?
Compare ETFs like a pro. Analyze fees, performance, exposure & holdings side-by-side.