Turn ETF ideas into real portfolios. Try the builder now →



Oil Market Weak Despite Production Cuts
ETF top story for the week of June 12 to 16, 2023.


Keep up with what matters in ETFs
Get timely ETF insights, market trends, and top ideas straight to your inbox.
Your newsletter subscriptions with us are subject to ETF Central's Privacy Policy and Terms and Conditions.
Unlike last year, the first half of 2023 has been a tough period for crude oil. Despite Saudi Arabia announcing production cuts, and the concerted endeavors of OPEC+ to curtail supplies until 2024, the WTI crude oil price has lost 10.57% year-to-date, pushing the S&P energy sector down 8.32%.
As the global crude oil market continues to grapple with low prices, there are three main reasons for this predicament.
Like what you're reading?
Stay in the loop — get the latest ETF insights: trends, analysis, and expert picks.
First, the surging influx of oil from Russia to China, Turkey, and India, its largest customers. Ironically, the EU sanctions against Russia have resulted in higher levels of Russian oil exports than was the case before the invasion of Ukraine.
Second, the United States increased its production level by 400,000 barrels per day (bpd) to reach 12.4 million bpd in June, according to data published by the Energy Information Administration. If this trend continues, the United States might break its February 2020 record of 13.1 million bpd. Meanwhile, other oil exporting countries, OPEC members included, need to increase their output as they are struggling to meet their debt payments.
Finally, the sluggish outlook for economic growth drives oil prices down. Indeed, the last OECD report states that global GDP growth is expected to be 2.7%, the lowest rate since the financial crisis of 2008 (except for 2020 in the wake of the Covid-19 outbreak).
This bearish trend led to ETFs such as the United States Oil Fund (USO) and the Fidelity MSCI Energy Index ETF (FENY) losing 2.25% and 0.41%, respectively, over the week. Investors echoed this sentiment by redeeming assets, with energy sector ETFs recording net outflows of 9.6 billion since the beginning of the year.
US Group Data

Funds Specific Data

Please note this article is for information purposes only and does not in any way constitute investment advice. It is essential that you seek advice from a registered financial professional prior to making any investment decision.
Segments
See all
Mentioned ETFs
Further reading


Latest ETF News
See all ETF newsMoneyShow Chart of the Day 9/4/26: Don't Just Watch Oil. Watch THESE.


Chart of the Day 8/14/26: The Great "Hot Money" Migration

MoneyShow Chart of the Day 7/29/26: Now, THAT's What I Call Market Rotation!

MoneyShow Chart of the Day 7/16/26: Good News/Bad News on Inflation (and the Fed)




 Advantages of ETFs over Mutual Funds1/6
Lower Costs
In this guide, we'll explore the advantages of ETFs over mutual funds, giving you valuable insights into why ETFs have gained significant popularity among investors like yourself.
Leveraged ETFs: Unlocking the Potential for Amplified Returns1/6
Understanding Leveraged ETFs
Explore leveraged ETFs: potential for amplified returns & risks. 5 ETFs to consider across equities, commodities & fixed income.
What is a Leveraged ETF?1/6
Introducing Leveraged and Inverse ETFs
In this guide, we'll dive into the world of leveraged ETFs, exploring their definition, mechanics, potential risks, and rewards.
Recent educational content

ETF Trends
ETF Industry KPIs September 8, 2026
This week’s KPI data overview highlights key metrics and trends shaping the ETF landscape.

ETF Trends
ETF Industry KPIs August 31, 2026
This week’s KPI data overview highlights key metrics and trends shaping the ETF landscape.
ETF Trends
ETF Industry KPIs August 24, 2026
This week’s KPI data overview highlights key metrics and trends shaping the ETF landscape.
What’sTheFund
What's the Fund | Ocean Park Diversified Income ETF (DUKZ)
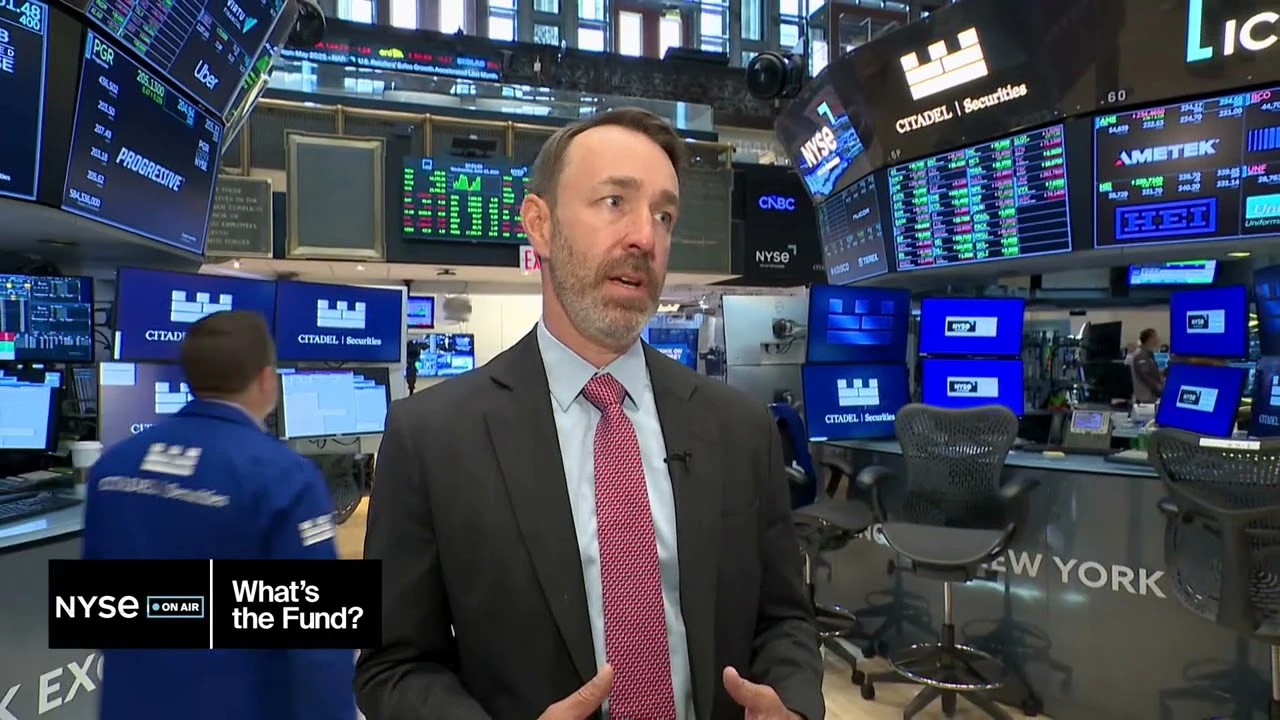
James St Aubin, Chief Investment Officer at Ocean Park Asset Management, discuss the DUKZ ETF, exposing investors to the whole spectrum of asset classes in the fixed income markets, through their rules-based process.

Browse all educational columns



Active Trader Report: Use of Leveraged & Inverse ETFs Way Up
Direxion partnered with Compound Insights and Vanda to explore what’s driving the evolution of active trading — and how active traders are using leveraged and inverse funds across equities, single stocks, commodities, and volatility.