Ready-made ETF portfolios built for real investor needs. Explore now →



NYSE MAC Desk Weekly Recap - January 13
The rally that started last Friday following the easing of wages within the employment report and decline in ISM Services has continued this week. Most of the gains happened ahead of the highly anticipated CPI report on Thursday which seemed to be driven by a fresh bout of FOMO as the soft landing narrative began to get some more traction.


Keep up with what matters in ETFs
Get timely ETF insights, market trends, and top ideas straight to your inbox.
Your newsletter subscriptions with us are subject to ETF Central's Privacy Policy and Terms and Conditions.
STRAIGHT FROM THE TRADING FLOOR
DOW 34,303 (+113), S&P 500 3,999 (+16), Russell 2000 1,887 (+11), NYSE FANG+ 4,780 (+36), ICE Brent Crude $85.43/barrel (+$1.40), Gold $1,923/oz (+$24), Bitcoin ~19.9k (+2295)
Like what you're reading?
Stay in the loop — get the latest ETF insights: trends, analysis, and expert picks.
The rally that started last Friday following the easing of wages within the employment report and decline in ISM Services has continued this week. Most of the gains happened ahead of the highly anticipated CPI report on Thursday which seemed to be driven by a fresh bout of FOMO as the soft landing narrative began to get some more traction. The negative sentiment and light positioning dynamics that have been in place for some time also helped to fuel this move. The data was spot on with expectations and continued to suggest that the inflationary pressures are easing. The equity market reaction to CPI was muted but major indices did end yesterday's session modestly higher.
Today was the official start of earnings of earnings season. If you missed it last night make sure to check out our Q4 Earnings Preview. Following the results from a handful of companies this morning there was a bit of weakness ahead of the open with S&P futures trading off ~1%. However, for the second consecutive day the pull back held above the previous day's low and major indices were able to end with modest gains. The S&P 500 pausing right around its 200d moving average (~3,985) a level that capped the two most recent rally attempts in August/December but we did rally into the close ending right at 4k. For the week the index was up 2.7% bringing YTD gains to 4.2%. On a side note, we did clear the second of the Stock Trader’s Almanac January Indicator Trifecta with the first five days of the year up 1.4%. The final indicator is the full month of January. Since 1950 there have been 31 instances where all three indicators were positive the index ended that calendar year higher by an average of 17.5% with only 3 negative years.
Last week one of the themes that we highlighted was the continued underperformance of tech/growth relative to the value factor. That did start to reverse last Friday and has swung completely in the other direction this week. After declining 1% last week the NYSE FANG+ index ended this week up 8.6%. Small caps also outperformed with the Russell 2k ending the week up ~5%. Defensive sectors like consumer staples, healthcare and utilities which all outperformed last year have been underperforming. One of the other things to note from a trading perspective is that we've seen the really speculative end of the spectrum start to move sharply higher including meme stocks and crypto etc. This is not the type of behavior the Federal Reserve wants to see.
Read the rest of the Weekly Recap here

Latest ETF News
See all ETF newsMoneyShow Chart of the Day 9/4/26: Don't Just Watch Oil. Watch THESE.


Chart of the Day 8/14/26: The Great "Hot Money" Migration

MoneyShow Chart of the Day 7/29/26: Now, THAT's What I Call Market Rotation!

MoneyShow Chart of the Day 7/16/26: Good News/Bad News on Inflation (and the Fed)




 Advantages of ETFs over Mutual Funds1/6
Lower Costs
In this guide, we'll explore the advantages of ETFs over mutual funds, giving you valuable insights into why ETFs have gained significant popularity among investors like yourself.
Leveraged ETFs: Unlocking the Potential for Amplified Returns1/6
Understanding Leveraged ETFs
Explore leveraged ETFs: potential for amplified returns & risks. 5 ETFs to consider across equities, commodities & fixed income.
What is a Leveraged ETF?1/6
Introducing Leveraged and Inverse ETFs
In this guide, we'll dive into the world of leveraged ETFs, exploring their definition, mechanics, potential risks, and rewards.
Recent educational content

ETF Trends
ETF Industry KPIs September 8, 2026
This week’s KPI data overview highlights key metrics and trends shaping the ETF landscape.

ETF Trends
ETF Industry KPIs August 31, 2026
This week’s KPI data overview highlights key metrics and trends shaping the ETF landscape.
ETF Trends
ETF Industry KPIs August 24, 2026
This week’s KPI data overview highlights key metrics and trends shaping the ETF landscape.
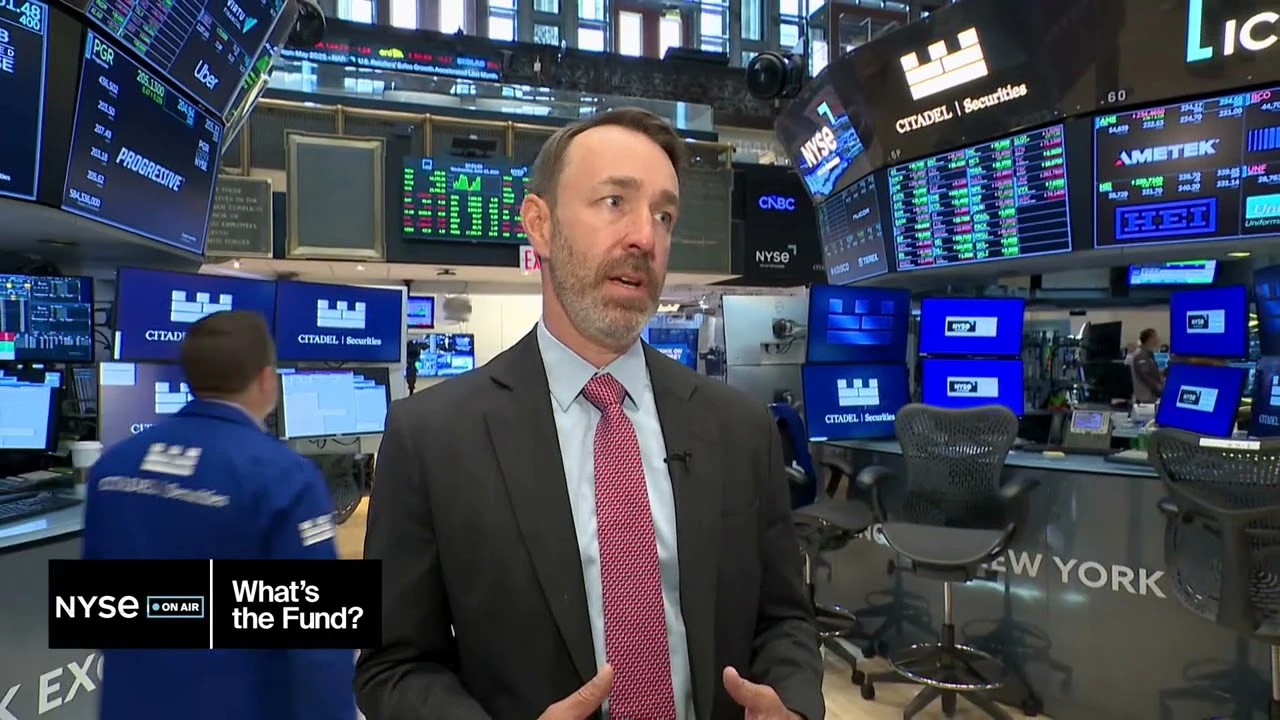
What’sTheFund
What's the Fund | Ocean Park Diversified Income ETF (DUKZ)
James St Aubin, Chief Investment Officer at Ocean Park Asset Management, discuss the DUKZ ETF, exposing investors to the whole spectrum of asset classes in the fixed income markets, through their rules-based process.

Browse all educational columns



Build and Analyze Your ETF Portfolio Like a Pro
Create your own ETF portfolio in minutes and instantly see allocations, exposures, performance, and risk. Visualize diversification across asset classes, regions, and sectors. Stress-test ideas, compare benchmarks, and refine your strategy with professional-grade analytics.
