NYSE CRTR Economy Event Watch the replay →

NYSE MAC Desk - October 7th Weekly Recap
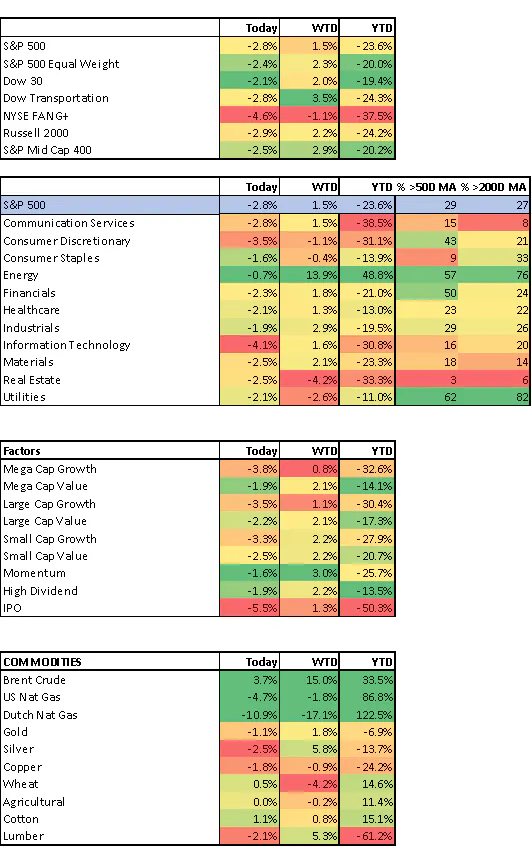
Last week equity markets closed at new YTD lows, with the S&P 500 ending the week lower for the sixth time in the last seven weeks. This capped off the worst monthly decline since March of 2020 (-9.3%) and the third consecutive quarter of losses (-5.3%).


Keep up with what matters in ETFs
Get timely ETF insights, market trends, and top ideas straight to your inbox.
Your newsletter subscriptions with us are subject to ETF Central's Privacy Policy and Terms and Conditions.
STRAIGHT FROM THE TRADING FLOOR
DOW 28,726 (-500), S&P 500 3,586 (-55), Russell 2000 1,665 (-10), NYSE FANG+ 4,692 (-55), ICE Brent Crude $87.96/barrel (-$0.53), Gold $1,668/oz (-$0), Bitcoin ~19.7k (+294)
Last week equity markets closed at new YTD lows, with the S&P 500 ending the week lower for the sixth time in the last seven weeks. This capped off the worst monthly decline since March of 2020 (-9.3%) and the third consecutive quarter of losses (-5.3%). Last week's losses were a mix of both the macro and the micro. On the macro front the concerns continued to revolve around slowing global growth, aggressive monetary policy and stresses within the financial systems that forced the BoE to intervene in Gilt markets. The micro included a round of disappointing earnings announcements with company's highlighting a drop off in demand.
This week was really about the extremes. We started off with the sharpest two-day rally since April of 2020 on re-emerging hopes for a Fed pivot and some softer economic data. However, a good portion of those gains were unwound over the last two days after hawkish Fed commentary and today's employment report seemed to rain on that parade. I would highlight that at least on the East Coast weather patterns moved in opposite directions which could be providing us with a positive divergence ;-).
The other big story this week was the larger than expected production quota cut by OPEC+ on Wednesday. While it seems unlikely that the announcement will actually cause 2ml b/d of oil to really come off the market, as members were already failing to hit their targets, estimates range between 800k-1ml b/d as to what this actually means to real supply. The news sent oil prices sharply higher. ICE Brent is up by more than 10% this week and nearly 20% from last week's lows. This move has drawn the ire of the administration with talk of NOPEC bills and export bans being thrown around but at the end of the day that won't help the cause.
Get data on 14,000+ ETFs
Access Trackinsight's reliable and comprehensive data with 500M+ points on 14,000+ ETFs.
Economic Data/Central Banks
At this point when thinking about monetary policy it's really about inflation data. Employment data is a distant second. Next week is inflation week and will leave investors uneasy over the weekend. This week was all about the labor market and the data was mixed. The key takeaway - nothing this week will cause the Fed to take its foot off the accelerator.
To recap, markets got excited by a ~1ml drop in the JOLTS job openings and a drop in the ISM manufacturing employment component into contractionary territory. However, the latter was not confirmed in the services survey and then today's BLS employment report didn't show any real signs of softening. The headline number was a touch ahead of street estimates with 263k jobs added to the economy verse estimates of ~250k. This was a slight deceleration from last month’s 315k and the smallest increase since April 2021. However, markets responded to the drop in unemployment rate which fell to 3.5% from last month’s 3.7%. This was driven primarily by a fall in the participation rate which ticked lower to 62.3% from 62.4% last month. Average hourly earnings were up 0.3% in line with estimates, while y/y was up 5% a tenth below.
The issue we keep coming back to is that leading indicators are showing signs that the economy is slowing but this is not yet flowing through to the official government data, which the Fed is relying upon. Hopes early in the week for a Fed pivot were sparked by last week's situation in the UK and then we also had the Reserve Bank of Australia hike rates by less than expected. They signaled they were going to slow the pace of hikes due to the cumulative effect of policy. Markets hoped this was the type of move the Fed might also make. However, Fed officials throughout the week have pushed back against both of these notions.
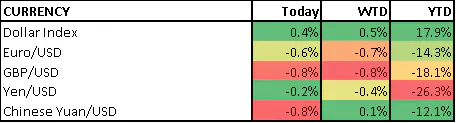
Rates and the US dollar index had started to move lower last week and did provide a tailwind early this week. However, this has reversed course over the last few days and taken the wind out of the sails of equity markets. The US dollar index traded down to ~$110 earlier this week before bouncing back to ~$112.75. Yields also had pulled back sharply early in the week but are once again back near YTD highs. Futures markets are now pricing in approximately an ~80% probability of a 75bps hike in November with rates peaking above 4.5% next year.
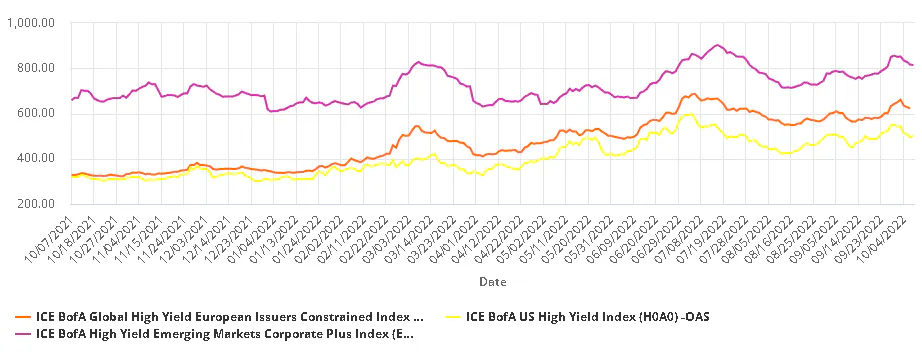
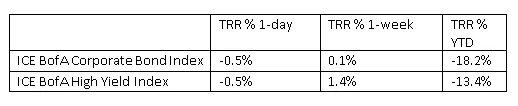
Corporate credit seemed to hold up pretty well this week until today. For the week the total return for the ICE BofA Corporate Credit index was up 0.1% while the High Yield Index was up 1.4%.
The Wrap
Most major US indices ended the week higher but with an over 2% selloff today the mood couldn't feel much more dour. Today's selloff felt like a bit of an overreaction to the data but you can also say the same about the rally to start the week. Next week is the start of earnings season and the recent announcements are definitely flashing warning signs with reports from Advanced Micro Devices (-14%) and Samsung overnight the most recent examples. According to FactSet Earnings Insight Q3 estimates have been cut by nearly 7% since the end of June, the largest decline since Q2 of 2020. The big question is whether Q2 was the last hurrah or if corporate earnings will continue to prove to be more resilient than street expectations. We'll have a preview in the coming days.
Other Asset Classes/Sectors:
Within equity markets energy was the clear standout up more than 10% this week with the commodity. Yield oriented/defensive sectors did underperform throughout the week.
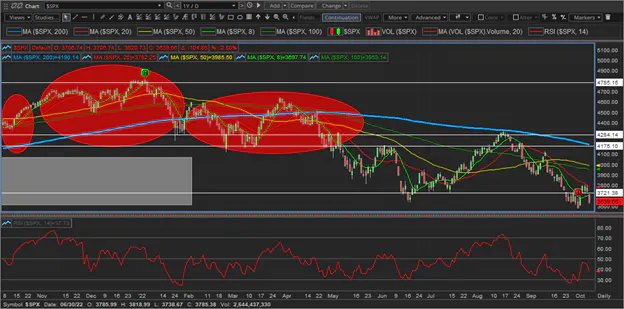
The Technicals Still Matter
On Monday, the S&P 500 quickly reclaimed the June lows around 3,636 and squeezed into the close. On Tuesday the index gapped right last week's high ~3,720 and then squeezed right up to the third level highlighted on the upside ~3,800 which coincides with the declining 20d and the 38.2% Fib. level that we recently broke down from. Interestingly we closed just above those June lows again today. The setup here still does not feel very good as we have just worked off the short term extreme oversold conditions.
Levels to watch:
Upside:
3,805 - 3,815 38.2% Fib. and this week's high
~3,900 level we broke down from in September
Downside
3,636 June Low
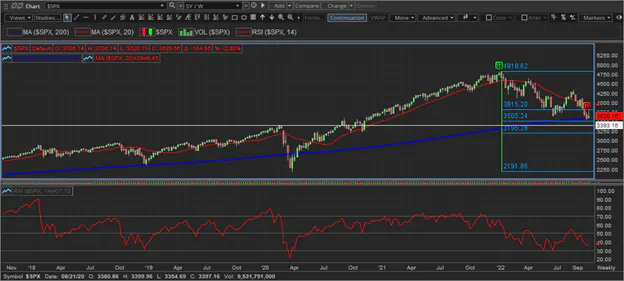
~3,585 last week's low and the 200W moving average
3,505 50% Fibonacci Retracement of pandemic rally and level we broke out from post 2020 elections
3,400 High prior to Covid selloff
Last Week
Equities remain in a short-term oversold state with the RSI around 28.50. The post BOE Wednesday rally likely caught traders who were trying to catch an oversold bounce wrong footed. This was relief valve for some of that oversold condition and brought in fresh sellers who ultimately needed to stop out of those positions. Part of the issue is that the market is oversold short-term but longer term indicators are not confirming this. We did close right on the 200W moving average ~3,590. This did act as support during selloffs in 2016, 2019 and to a lesser extent in 2020.
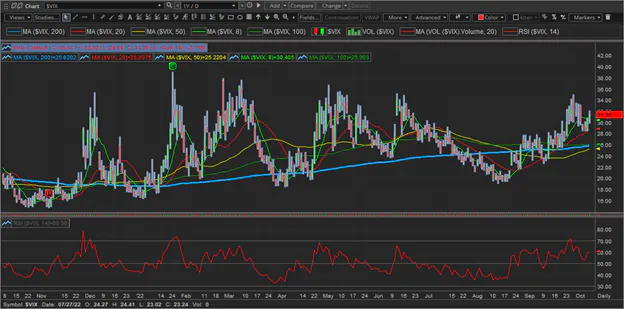
The VIX pulled back to just under 30 but held never really moved lower. This does feel like we could be setting up for a push through 35.
Last Week
The VIX did touch YTD highs ~35 earlier this week and pulled back. It was interesting that the VIX did end lower today despite market weakness which could potentially just be people not wanting the Theta bleed over the weekend. It might also suggest the weakness into the close was more related to quarter end rebalancing. The overall market selling has been orderly thus far. Futures still signaling some strain but not extreme.
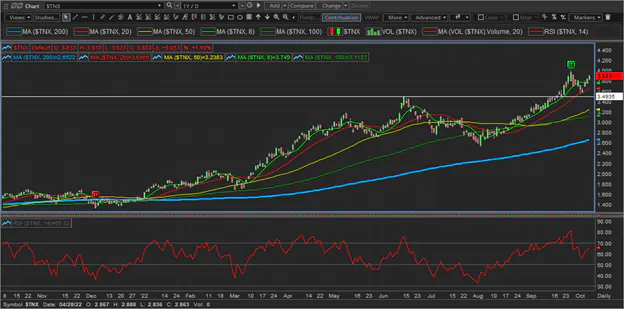
10yr yield pulled back to the 20d to work off overbought conditions but has moved right back to YTD highs.
Last week
10yr broke above 3.5% and surged to 4% before reversing on BoE announcement. One interesting thing is that we are not seeing a flight to safety bid show up here yet.
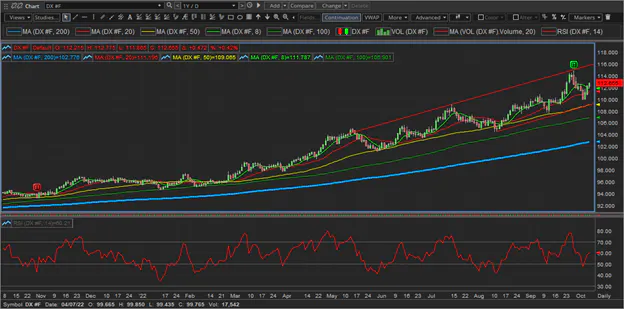
The USD did get some downside follow through to test the recent breakout area ~$110 but reversed sharply to end the week higher. There is still underlying strength.
Last Week
USD had a bit of a short-term reversal pattern at the upper end of the recent channel with an outside day on Wednesday following the BoE intervention. It had gotten extended short-term so a pull back is not surprising. Watching this week's low ~111.50 for some downside follow through. A retest of the recent breakout ~110 would not be surprising below that watch the rising 50d ~108.5. The list of interveners has been growing.
After breaking the key level ~7.50 level nat gas has pulled back and held around the 200d this looks susceptible to move lower here.

Gold - Failed right at the 50d and downtrend line. It did pull back but held up reasonably well considering the dollar bounce.
Last week
Some interesting action here. A little oversold bounce back to broken support with a bit of a positive divergence. Keeping an eye on this as it has really just become a dollar proxy so could give some clues.

What’s on Tap Next Week
Monday is a holiday in the US but equity markets will be open (credit markets closed). This week was Jobs Week and next will be Inflation Week. The key data will be PPI/CPI released on Wednesday/Thursday, respectively. Inflation expectations in the NY Fed (Tues) and U of Mich. Sentiment Survey (Fri.) will also be closely watched. The other impactful piece of economic data will be US retail sales (Fri). China's inflation and trade data will also be released on Friday. Also keep in mind China markets re-open on Monday after being closed this week and the China Communist Party Congress begins next weekend. Central bank commentary will remain at the forefront with the Fed Minutes on Wednesday one of the highlights. The BoE emergency measures expire next Friday which is creating some angst. The IMF/World Bank annual meting begins on Monday and on Wed/Thurs. G20 finance ministers/central bankers meet. Keep an eye out for communique related to currencies and market function. At the end of the week the focus may start to shift back to the micro from the macro as earnings season "officially" gets underway with a handful of major financials reporting. Enjoy the weekend!

Latest ETF News
See all ETF newsMoneyShow Chart of the Day 6/3/26: AI. AI. AI. (And a Handful of Other Stocks, Too)

MoneyShow Chart of the Day 5/27/26: SpaceX Hype Sends Space Stocks into Orbit


 Advantages of ETFs over Mutual Funds1/6
Lower Costs
In this guide, we'll explore the advantages of ETFs over mutual funds, giving you valuable insights into why ETFs have gained significant popularity among investors like yourself.
Leveraged ETFs: Unlocking the Potential for Amplified Returns1/6
Understanding Leveraged ETFs
Explore leveraged ETFs: potential for amplified returns & risks. 5 ETFs to consider across equities, commodities & fixed income.
What is a Leveraged ETF?1/6
Introducing Leveraged and Inverse ETFs
In this guide, we'll dive into the world of leveraged ETFs, exploring their definition, mechanics, potential risks, and rewards.
Recent educational content

Asset TV
The ETF Show - New Autism-Impact ETF Launched
Defiance ETFs has launched the first ETF, $ASD, focused on the autism ecosystem, investing in companies that provide services, products, and research related to autism and neurodivergence.


ETF Trends
ETF Industry KPIs June 1, 2026
The ETF Industry saw 22 New Launches, 1 Ticker Change and 1 closure last week.
ETF Trends
ETF Industry KPIs May 20, 2026
The ETF Industry saw 44 New Launches, 3 Mutual Fund Conversions and 9 closures last week.

Asset TV
The ETF Show - Politics Becomes Investable Trade through ETFs
Dan Weiskopf, Senior Portfolio Manager at Tidal Financial Group spoke with the ETF Show about Subversive ETFs that help investors trade like politicians.
Browse all educational columns

The ETF Industry Is Evolving Fast
From AI infrastructure to active strategies, the ETF landscape is shifting. Share your perspective in the 7th Annual Global ETF Survey and get exclusive early access to the final report.
