Open Now: The Global ETF Survey Take the Survey →



Natural Gas Futures Plunge Due to Milder Weather and Reduced LNG Exports | ETFs to Watch
U.S. natural gas futures plummeted this week, dipping below a key price level due to milder weather forecasts and reduced feedgas to LNG export plants.


Keep up with what matters in ETFs
Get timely ETF insights, market trends, and top ideas straight to your inbox.
Your newsletter subscriptions with us are subject to ETF Central's Privacy Policy and Terms and Conditions.
Impact of Milder Weather Forecasts
Meteorologists predict near-normal weather across the Lower 48 states until July 24, followed by hotter-than-normal conditions until August 1. This expectation of milder weather has reduced the demand for natural gas, contributing to the futures' sharp decline.
The ETF Industry Is Evolving Fast
From AI infrastructure to active strategies, the ETF landscape is shifting. Share your perspective in the 7th Annual Global ETF Survey and get exclusive early access to the final report.
Reduced Feedgas to LNG Export Plants
Gas flows to U.S. LNG export facilities fell to 11.6 bcfd in July, down from 12.8 bcfd in June. This decrease is mainly due to the extended shutdown of Freeport LNG and operational cuts at Cheniere Energy's Corpus Christi plant. Freeport LNG has been offline longer than expected due to Hurricane Beryl, delaying seven to ten shipments. Although one processing unit is set to restart this week, others will resume at reduced capacity.
EIA Storage Report Insights
The EIA reported that U.S. utilities added only 10 billion cubic feet (Bcf) of gas into storage last week, significantly below the anticipated 28 Bcf increase. This brings total stockpiles to 3,209 Bcf, 16.9% above the five-year average. The smaller-than-expected storage increase has also influenced the price decline.
Short-term Natural Gas Outlook
The EIA estimates the Henry Hub natural gas spot price to average $2.90/MMBtu in the second half of 2024, up from $2.10/MMBtu in the first half. U.S. dry natural gas production is projected to decrease slightly due to reduced drilling and production curtailments. Natural gas storage injections are expected to fall below the five-year average, reducing the storage surplus. Prices are anticipated to rise to $3.30/MMBtu in 2025, driven by new demand from LNG export projects.
AI Data Centers and the Bullish Outlook for Natural Gas
Oilfield expert David Messler recently emphasized in an article on oilprice.com that AI data centers could generate fresh demand for natural gas, potentially benefiting the market and undervalued gas-focused E&P stocks. Messler pointed out that the surge in energy consumption by AI operations, particularly during the training and inference stages of AI models, is driving this trend.
He discussed Jevon's Paradox, which suggests that improvements in energy efficiency within AI technology will likely increase overall energy consumption rather than decrease it. Messler noted that, as a result, natural gas stands to gain substantially, given the declining preference for coal and the inability of new nuclear power plants to meet immediate energy needs. He concluded that this emerging demand from AI could significantly boost the prospects for natural gas through the end of the decade.
Natural Gas ETFs to Watch
Despite its price volatility, natural gas offers a cleaner burning option in the fossil fuel sector with potential for growth. Rising demand as a transitional fuel and price fluctuations present opportunities for investors seeking higher returns or portfolio diversification. However, careful research remains crucial.
Here are Natural Gas ETFs to consider:
The United States 12 Month Natural Gas Fund LP
UNL invests in natural gas futures contracts spread evenly across the next 12 months, which helps to mitigate the impact of short-term price volatility and contango effects. This results in a more stable performance relative to the front-month contracts. UNL has a lower expense ratio of 0.90% and tends to be less volatile and less risky compared to UNG.
UNG, on the other hand, focuses on the front-month natural gas futures contracts, which are the nearest contracts to expire. This approach can lead to higher volatility and greater susceptibility to the negative effects of contango, where the futures prices are higher than the spot prices. UNG has a higher expense ratio of 1.33% and has historically experienced larger drawdowns and more significant underperformance compared to UNL.
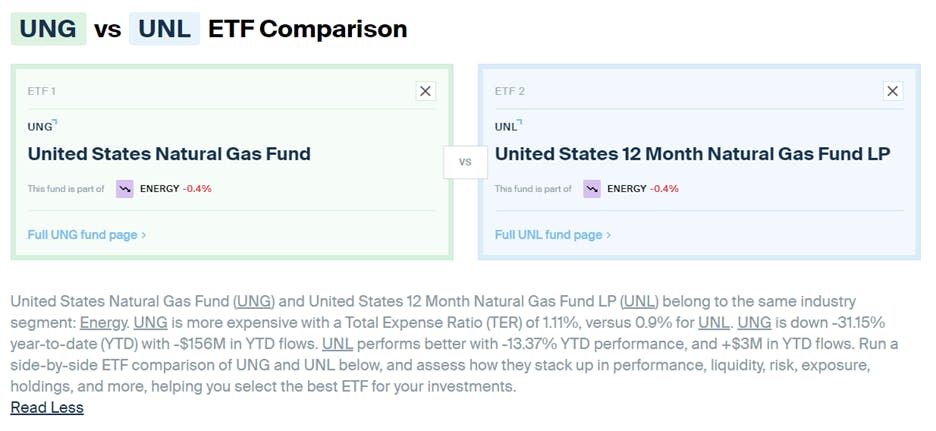
View Full Comparison
Another ETF to consider is the First Trust Natural Gas ETF
It focuses on mid and large-capitalization companies that derive a substantial portion of their revenue from the exploration and production of natural gas, as well as from midstream activities. FCG provides investors with exposure to the natural gas industry through a diversified portfolio of stocks, primarily in the U.S. energy sector. With an expense ratio of 0.60%, this ETF offers a way for investors to participate in the natural gas market without directly investing in commodities or individual companies.
Please note this article is for information purposes only and does not in any way constitute investment advice. It is essential that you seek advice from a registered financial professional prior to making any investment decision.
Segments
See all
Mentioned ETFs
Further reading


Latest ETF News
See all ETF newsMoneyShow Chart of the Day 7/16/26: Good News/Bad News on Inflation (and the Fed)


MoneyShow Chart of the Day 7/1/26: The H1 Scorecard – and What Comes Next

MoneyShow Chart of the Day 6/22/26: Are World Cup Videos Helping US Companies Clean Up?

MoneyShow Chart of the Day 6/3/26: AI. AI. AI. (And a Handful of Other Stocks, Too)




 Advantages of ETFs over Mutual Funds1/6
Lower Costs
In this guide, we'll explore the advantages of ETFs over mutual funds, giving you valuable insights into why ETFs have gained significant popularity among investors like yourself.
Leveraged ETFs: Unlocking the Potential for Amplified Returns1/6
Understanding Leveraged ETFs
Explore leveraged ETFs: potential for amplified returns & risks. 5 ETFs to consider across equities, commodities & fixed income.
What is a Leveraged ETF?1/6
Introducing Leveraged and Inverse ETFs
In this guide, we'll dive into the world of leveraged ETFs, exploring their definition, mechanics, potential risks, and rewards.
Recent educational content

ETF Trends
ETF Industry KPIs July 20, 2026
This week’s KPI data overview highlights key metrics and trends shaping the ETF landscape.

ETF Trends
ETF Industry KPIs July 13, 2026
This week’s KPI data overview highlights key metrics and trends shaping the ETF landscape.

First Look ETF
First Look ETF: Cash Deployment, Bond, and Hedged ETFs
In this season 6 episode of First Look ETF, Stephanie Stanton examines the latest ETF marketplace trends with NYSE and guests.

ETF Trends
ETF Industry KPIs July 6, 2026
This week’s KPI data overview highlights key metrics and trends shaping the ETF landscape.
Browse all educational columns



Active Trader Report: Use of Leveraged & Inverse ETFs Way Up
Direxion partnered with Compound Insights and Vanda to explore what’s driving the evolution of active trading — and how active traders are using leveraged and inverse funds across equities, single stocks, commodities, and volatility.