Keep tabs on your favorite ETFs with a personalized weekly tracker. Create a Watchlist now →



MoneyShow Chart of the Day 9/16/26: Oil? Surging. Oil Stocks? Not So Much.
Oil may be surging, but the real energy shock is happening further down the barrel, where diesel and gasoline prices are leaving crude behind.


Keep up with what matters in ETFs
Get timely ETF insights, market trends, and top ideas straight to your inbox.
Your newsletter subscriptions with us are subject to ETF Central's Privacy Policy and Terms and Conditions.
We have a run for the ages underway in crude oil. Both WTI and Brent futures have surged by more than 20% in just a few weeks. But interestingly, oil stocks have been lagging behind. Is that an opportunity?
Take a look at my MoneyShow Chart of the Day. It shows the one-month percentage change in WTI and Brent crude oil futures, plus the State Street SPDR S&P Oil & Gas Exploration & Production ETF
Get data on 14,000+ ETFs
Access Trackinsight's reliable and comprehensive data with 500M+ points on 14,000+ ETFs.
WTI (Red), Brent (Black), XOP (Blue), XLE (Green)
1-Month % Change
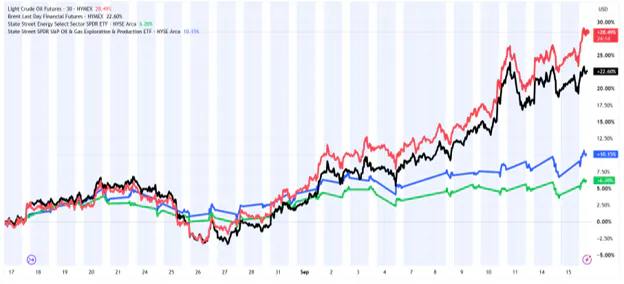
Source: TradingView
Now, I don’t want to beat up on the XLE and XOP TOO much here. The benchmark ETFs for diversified energy companies and explorers and producers, respectively, are both having phenomenal years. XLE is up 44% and XOP is up 54%. But even those gains lag behind the year-to-date price moves in crude (84% for WTI, 79% for Brent).
Some of that could stem from the lousy performance of natural gas. US gas futures are down more than 18% YTD, something that can weigh on integrated oil and gas companies.
Some of the divergence may come from the fact energy stocks are still STOCKS. If the overall market struggles, as we’ve seen with the S&P 500 Index lately, it can weigh on equities broadly.
Some of it may be driven by the fact traders expect oil prices to retreat in the out-months if Middle East tensions subside. Oil futures contracts for delivery in mid-to-late 2027 are priced in the $70s, for instance.
So, what’s the opportunity? If you’re an energy bull who thinks oil the commodity will remain “higher for longer,” you can take advantage of this situation by adding more energy stock exposure – both on an absolute basis and relative to the market. Food for thought amid this latest, greatest divergence.
If you want to get more articles and chart analysis from MoneyShow, subscribe to our Top Pros’ Top Picks newsletter here
Please note: This is syndicated content and reflects the author’s personal views. It does not represent the opinions of this publication or its affiliates. The article is for informational purposes only and does not constitute investment advice. Always consult a registered financial professional before making any investment decisions.
Segments
See all
Mentioned ETFs
Further reading

Latest ETF News
See all ETF newsWhich Fixed-Income ETFs Benefit from Rising Interest Rates?


MoneyShow Chart of the Day 9/4/26: Don't Just Watch Oil. Watch THESE.

Chart of the Day 8/14/26: The Great "Hot Money" Migration

MoneyShow Chart of the Day 7/29/26: Now, THAT's What I Call Market Rotation!



 Advantages of ETFs over Mutual Funds1/6
Lower Costs
In this guide, we'll explore the advantages of ETFs over mutual funds, giving you valuable insights into why ETFs have gained significant popularity among investors like yourself.
Leveraged ETFs: Unlocking the Potential for Amplified Returns1/6
Understanding Leveraged ETFs
Explore leveraged ETFs: potential for amplified returns & risks. 5 ETFs to consider across equities, commodities & fixed income.
What is a Leveraged ETF?1/6
Introducing Leveraged and Inverse ETFs
In this guide, we'll dive into the world of leveraged ETFs, exploring their definition, mechanics, potential risks, and rewards.
Recent educational content

ETF Trends
ETF Industry KPIs September 14, 2026
This week’s KPI data overview highlights key metrics and trends shaping the ETF landscape.

ETF Trends
ETF Industry KPIs September 8, 2026
This week’s KPI data overview highlights key metrics and trends shaping the ETF landscape.
ETF Trends
ETF Industry KPIs August 31, 2026
This week’s KPI data overview highlights key metrics and trends shaping the ETF landscape.
ETF Trends
ETF Industry KPIs August 24, 2026
This week’s KPI data overview highlights key metrics and trends shaping the ETF landscape.
Browse all educational columns



Build and Analyze Your ETF Portfolio Like a Pro
Create your own ETF portfolio in minutes and instantly see allocations, exposures, performance, and risk. Visualize diversification across asset classes, regions, and sectors. Stress-test ideas, compare benchmarks, and refine your strategy with professional-grade analytics.
