Open Now: The Global ETF Survey Take the Survey →

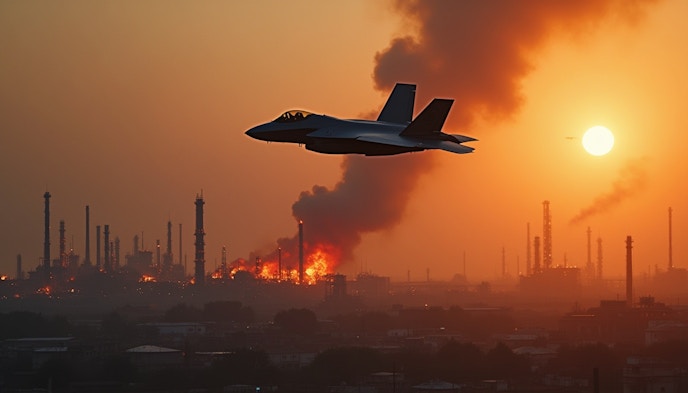
MoneyShow Chart of the Day 6/16/25: After Attacks, What's Next for Energy Stocks?
Middle East conflict lifts oil; is the Energy Select Sector SPDR ETF (XLE) breaking out? See the chart and what it could mean for energy investors.
Keep up with what matters in ETFs
Get timely ETF insights, market trends, and top ideas straight to your inbox.
Your newsletter subscriptions with us are subject to ETF Central's Privacy Policy and Terms and Conditions.
Late last week, Israel launched a powerful wave of strikes on Iran — a move aimed at halting its nuclear ambitions and sending shockwaves through global markets.
Naturally, I hope for a negotiated, peaceful end to this conflict – and I’m sure you do, too. But markets will keep trading anyway as the conflict unfolds.
The ETF Industry Is Evolving Fast
From AI infrastructure to active strategies, the ETF landscape is shifting. Share your perspective in the 7th Annual Global ETF Survey and get exclusive early access to the final report.
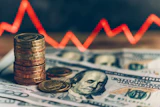
Given the surge in oil prices that followed the strikes, it’s only logical for traders to ask: “What’s next for energy stocks?”
Check out this MoneyShow Chart of the Day. It shows the performance of the Energy Select Sector SPDR Fund

Data by YCharts
You can see that over the longer term, there hasn’t been much performance to speak of. The energy conglomerates that dominate XLE – like Exxon Mobil Corp. (XOM) and ConocoPhilips (COP) – haven’t gained much...or lost value...in the past year.
The same goes for energy services firms like Schlumberger Ltd. (SLB) and refiners like Valero Energy Corp. (VLO) that are in XLE.
But the XLE DID experience a high-volume washout in April during the tariff-driven turmoil. It made a series of higher lows since then, even before the Israeli strikes. Then it attempted a high-volume break above gap resistance – and the 200-day moving average – on Friday.
I don’t know how this latest Middle East conflict will unfold. But if I didn’t see the news at all – and just looked at this chart – I’d say we could have a serious trend reversal underway.
I’d watch for a couple days to see if the breakout holds. And if so, I’d be ready to buy.
If you want to get more articles and chart analysis from MoneyShow, subscribe to our Top Pros’ Top Picks newsletter here
Please note: This is syndicated content and reflects the author’s personal views. It does not represent the opinions of this publication or its affiliates. The article is for informational purposes only and does not constitute investment advice. Always consult a registered financial professional before making any investment decisions.
Segments
See all
Mentioned ETFs
Further reading


Latest ETF News
See all ETF newsMoneyShow Chart of the Day 7/16/26: Good News/Bad News on Inflation (and the Fed)
MoneyShow Chart of the Day 7/1/26: The H1 Scorecard – and What Comes Next

MoneyShow Chart of the Day 6/22/26: Are World Cup Videos Helping US Companies Clean Up?

MoneyShow Chart of the Day 6/3/26: AI. AI. AI. (And a Handful of Other Stocks, Too)


 Advantages of ETFs over Mutual Funds1/6
Lower Costs
In this guide, we'll explore the advantages of ETFs over mutual funds, giving you valuable insights into why ETFs have gained significant popularity among investors like yourself.
Leveraged ETFs: Unlocking the Potential for Amplified Returns1/6
Understanding Leveraged ETFs
Explore leveraged ETFs: potential for amplified returns & risks. 5 ETFs to consider across equities, commodities & fixed income.
What is a Leveraged ETF?1/6
Introducing Leveraged and Inverse ETFs
In this guide, we'll dive into the world of leveraged ETFs, exploring their definition, mechanics, potential risks, and rewards.
Recent educational content

ETF Trends
ETF Industry KPIs July 20, 2026
This week’s KPI data overview highlights key metrics and trends shaping the ETF landscape.
ETF Trends
ETF Industry KPIs July 13, 2026
This week’s KPI data overview highlights key metrics and trends shaping the ETF landscape.

First Look ETF
First Look ETF: Cash Deployment, Bond, and Hedged ETFs
In this season 6 episode of First Look ETF, Stephanie Stanton examines the latest ETF marketplace trends with NYSE and guests.

ETF Trends
ETF Industry KPIs July 6, 2026
This week’s KPI data overview highlights key metrics and trends shaping the ETF landscape.
Browse all educational columns

The ETF Industry Is Evolving Fast
From AI infrastructure to active strategies, the ETF landscape is shifting. Share your perspective in the 7th Annual Global ETF Survey and get exclusive early access to the final report.
