NYSE CRTR Economy Event Watch the replay →



Meet the Ultra-Affordable, Zero-Expense Ratio ETFs from BNY Mellon
This ETF duo is the perfect way for a budget-conscious investor to gain exposure to the broad U.S. stock and bond markets.


Keep up with what matters in ETFs
Get timely ETF insights, market trends, and top ideas straight to your inbox.
Your newsletter subscriptions with us are subject to ETF Central's Privacy Policy and Terms and Conditions.
I do ETF analysis for a living, so I usually consider myself on top of the ball when it comes to new or niche ETFs. For some time now, I thought the cheapest ETF available was the SPDR Portfolio S&P 500 ETF (SPLG) at 0.02%. Turns out I was wrong.
I'm ashamed to say that after using the ETF Central screener a bit and sorting the results by ascending expense ratio, I noticed there were actually two zero-expense ratio options. That's right, 0% in fees.
This affordable duo from BNY Mellon is essentially the ETF industry's version of Fidelity's ZERO mutual funds, and I think they're worth a look if you hate fees as much as most people do. Here's what you need to know before you buy.
Get data on 14,000+ ETFs
Access Trackinsight's reliable and comprehensive data with 500M+ points on 14,000+ ETFs.
BNY Mellon US Large Cap Core Equity ETF BKLC
First up is BKLC, which tracks the Solactive GBS United States 500 Index TR (TR stands for "total return," meaning with dividends reinvested).
This index differs from the S&P 500 in several ways. First, it lacks the committee process—nobody is deciding which companies to add or drop and there is no positive earnings screener, making it far more passive.
Instead, this index simply holds the largest 500 companies by market cap and weights them by free-float market capitalization, which means that only shares available to the public are considered in the weighting process.
Practically speaking, the top holdings and sector exposure are more or less identical to the S&P 500. Here are the results from the new ETF Central comparison tool:
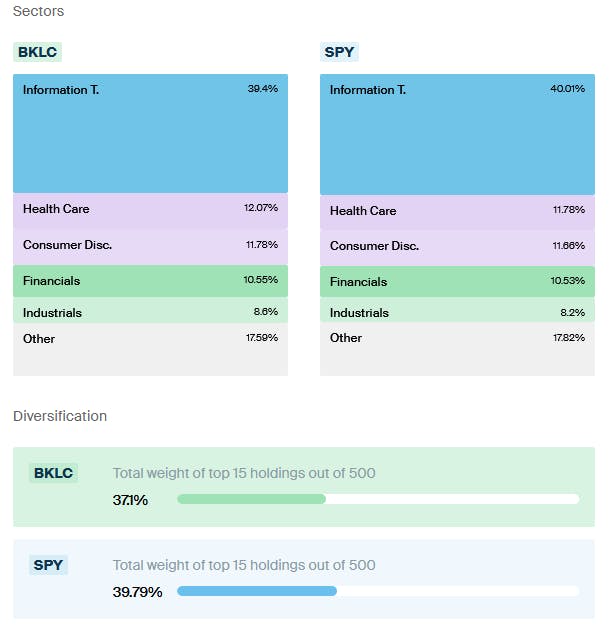
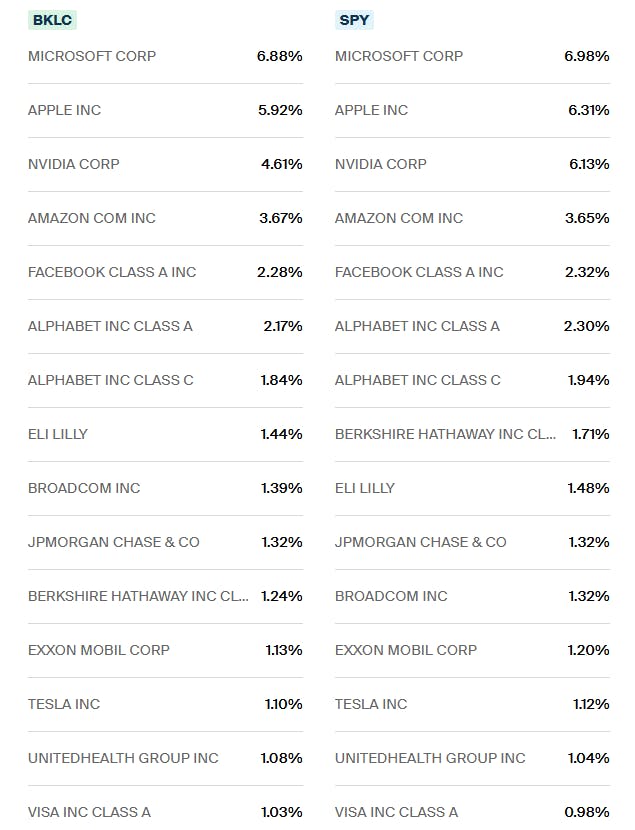
BKLC has been around since April 2020 and has accrued over $2.5 billion in AUM. Honestly, I'm shocked I haven't noticed it earlier, but now's the time to get more eyes on it!
BNY Mellon Core Bond ETF BKAG
The lower-risk complement to BKLC for the classic "two-fund" portfolio is BKAG, which tracks the Bloomberg US Aggregate Total Return Index.
This index is pretty much the bond industry's version of the S&P 500. It tracks a portfolio of Treasury bonds, agency-issued bonds, mortgage-backed securities, and investment-grade corporate bonds of multiple maturities.
The portfolio characteristics of BKAG are what I'd expect from an aggregate bond ETF in 2024: a weighted average yield to maturity of 5%, which is the total return expected if all underlying bonds are held to maturity, and an average duration of 6.16 years, indicating its sensitivity to interest rates. Plus, it offers the usual monthly distributions.
BKAG boasts $1.76 billion in AUM, and with a 0% expense ratio, it manages to undercut two of the most popular options on the market that offer similar exposure: the iShares Core U.S. Aggregate Bond ETF
Final Thoughts
As of July 15th, if you wanted to create the cheapest ETF portfolio possible, buying these two on a no-commission brokerage is the way to go. Both ETFs are refreshingly liquid thanks to their underlying holdings, so the bid-ask spread is minimal.
They're not obscure niche products either. Both ETFs are at a very healthy size and are at no risk of closing down. Frankly, I'm shocked that they haven't grown larger yet as fees are one of the most contested parts of the ETF industry.
Hopefully, other asset managers follow suit and lower fees or eliminate them altogether for "core" ETF segments like broad market equities and fixed income. Competition is good and hats off to BNY Mellon for stepping up to set the bar high.
Please note this article is for information purposes only and does not in any way constitute investment advice. It is essential that you seek advice from a registered financial professional prior to making any investment decision.
Latest ETF News
See all ETF news
The SpaceX (SPCX) IPO: Here's Which ETFs Already Own it

ETF Comparison: Vanguard FTSE Emerging Markets ETF (VWO) Versus iShares Core MSCI Emerging Markets ETF (IEMG)



 Advantages of ETFs over Mutual Funds1/6
Lower Costs
In this guide, we'll explore the advantages of ETFs over mutual funds, giving you valuable insights into why ETFs have gained significant popularity among investors like yourself.
Leveraged ETFs: Unlocking the Potential for Amplified Returns1/6
Understanding Leveraged ETFs
Explore leveraged ETFs: potential for amplified returns & risks. 5 ETFs to consider across equities, commodities & fixed income.
What is a Leveraged ETF?1/6
Introducing Leveraged and Inverse ETFs
In this guide, we'll dive into the world of leveraged ETFs, exploring their definition, mechanics, potential risks, and rewards.
Recent educational content
Asset TV
The ETF Show - New Autism-Impact ETF Launched
Defiance ETFs has launched the first ETF, $ASD, focused on the autism ecosystem, investing in companies that provide services, products, and research related to autism and neurodivergence.


ETF Trends
ETF Industry KPIs June 1, 2026
The ETF Industry saw 22 New Launches, 1 Ticker Change and 1 closure last week.

ETF Trends
ETF Industry KPIs May 20, 2026
The ETF Industry saw 44 New Launches, 3 Mutual Fund Conversions and 9 closures last week.
Asset TV
The ETF Show - Politics Becomes Investable Trade through ETFs
Dan Weiskopf, Senior Portfolio Manager at Tidal Financial Group spoke with the ETF Show about Subversive ETFs that help investors trade like politicians.
Browse all educational columns



The ETF Industry Is Evolving Fast
From AI infrastructure to active strategies, the ETF landscape is shifting. Share your perspective in the 7th Annual Global ETF Survey and get exclusive early access to the final report.