Explore professionally built ETF model portfolios. Discover now →



Losers Of Q2 2026 REIT Earnings Season
In Part 2, now turn to the laggards - including outright disappointments and in-line performers that failed to keep pace with the broader REIT rally.


Keep up with what matters in ETFs
Get timely ETF insights, market trends, and top ideas straight to your inbox.
Your newsletter subscriptions with us are subject to ETF Central's Privacy Policy and Terms and Conditions.
Summary
- Not Every REIT Joined The Recovery: Part 2 focuses on the relatively small group of laggards where company-specific credit, legal, refinancing, or asset-level issues overshadowed an otherwise very strong earnings.
Like what you're reading?
Stay in the loop — get the latest ETF insights: trends, analysis, and expert picks.
- Weakness Was More Company-Specific Than Sector-Wide: Empire State Realty’s Observatory shortfall, JBG Smith’s adverse Wardman Tower ruling, Community Healthcare’s dividend cut, and several troubled mortgage portfolios drove some of the.
- Mortgage Stress Hasn’t Fully Cleared: Commercial mREIT book values fell nearly 5% on average as office, lab space, and multifamily credit problems persisted for some sponsors.
- Fine, Not Flashy: Apartments, Medical Office, Cell Tower, Strip Center, Casino, Cold Storage, and Farmland generally showed stable or improving fundamentals, but lacked enough upside to overcome renewed rate pressure.
- M&A Still Put A Floor Under Valuations: The LXP Industrial and Cherry Hill Mortgage takeouts reinforced continued private-market demand for discounted public REITs, even as elevated rates continued to pressure public-market multiples.
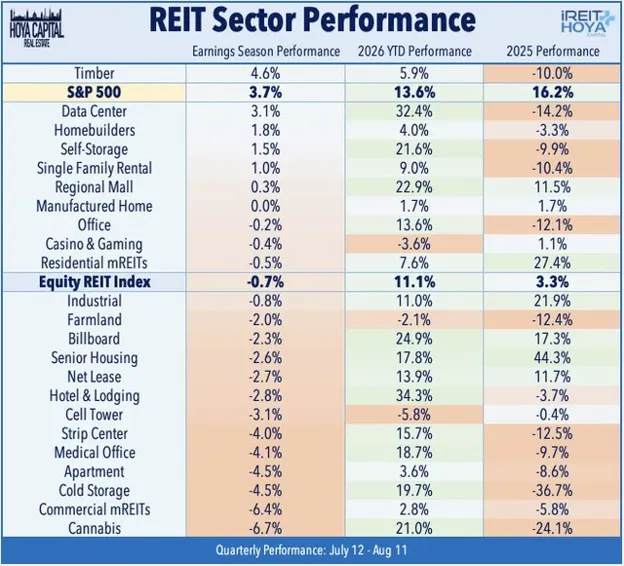
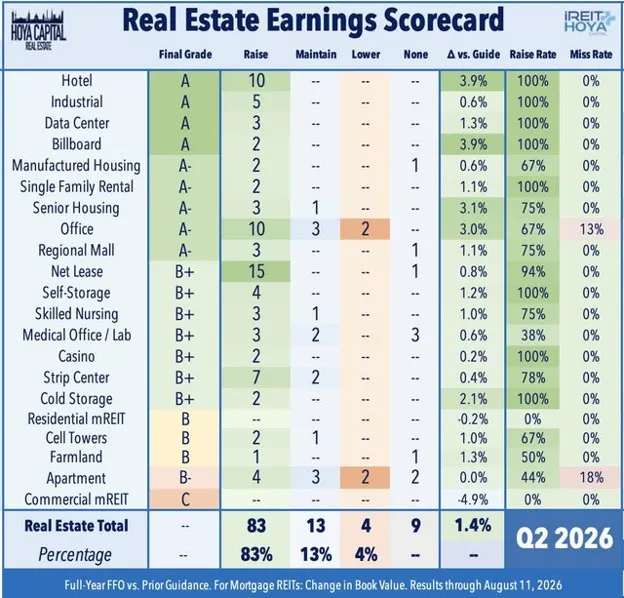
As noted in Part 1, overall REIT earnings results were surprisingly strong and delivered one of the cleanest reporting periods in recent memory, with upside surprises broadening across sectors even as higher interest rates weighed on stock-price performance. Of the 100 equity REITs that provided formal full-year FFO guidance, 83 REITs - or 83% - raised their outlooks, while 13 REITs - or 13% - maintained guidance, and just 4 REITs - or 4% - lowered guidance. The average outlook increased by 1.4% from prior guidance. Yet the strong fundamental scorecard translated into little aggregate stock-price appreciation, with the Equity REIT ETF higher by just 0.1% during earnings season compared with a 3.7% gain from the S&P 500. While there were few outright bombshells, the handful of laggards were concentrated in company-specific credit, legal, refinancing, or asset-level issues which overshadowed an otherwise solid-to-strong property-level performance trends.
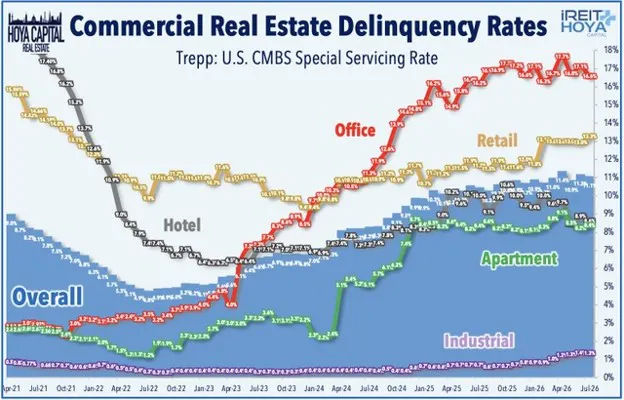
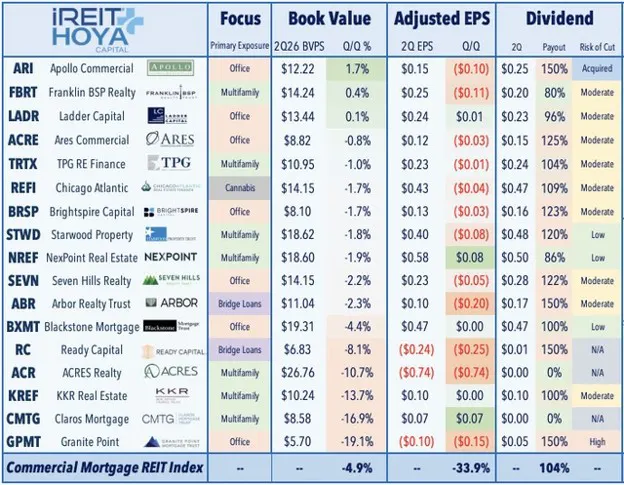
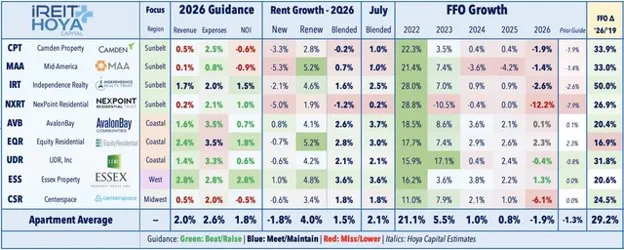
Commercial Mortgage REITs were the clearest downside standout this earnings season, with average book value declining 4.9% sequentially as troubled multifamily, office, and life-science loans continued to migrate toward market-clearing values. Claros Mortgage, KKR Real Estate Finance, ACRES Realty, Granite Point, and Blackstone Mortgage were among the most heavily impacted, while dividend coverage remains stretched across much of the group. Lab Space remained firmly in the trough phase of its cycle, with Alexandria maintaining an outlook for a 29% FFO decline, 9.5% same-store NOI contraction, 11% negative cash leasing spreads, and year-end occupancy of just 87%. Apartment REITs produced a soft scorecard, with two guidance reductions and average expected 2026 FFO growth slipping to -1.9%, although steadily improving July leasing spreads suggest the fundamental bottom is drawing closer. Residential Mortgage REITs were considerably more stable, with average book value essentially flat at -0.2% and adjusted earnings rebounding more than 20% sequentially, but individual results remained highly uneven. Farmland REITs also remained challenged by tenant, crop, and lease-restructuring issues, although improving almond and pistachio pricing provided a more constructive backdrop entering the second half.
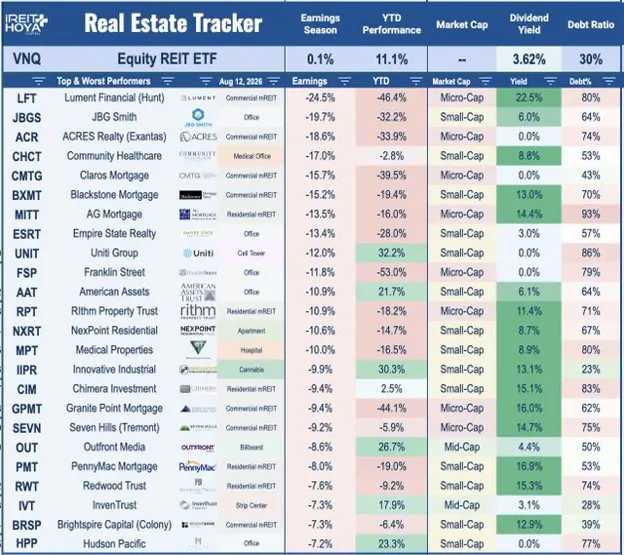
Several other property sectors landed closer to the “in-line” bucket rather than the outright loser category. Medical Office REITs were generally constructive, with Healthcare Realty and Healthpeak improving their earnings outlooks, but Community Healthcare’s 31% dividend cut and Medical Properties Trust’s expensive refinancing highlighted lingering company-specific balance-sheet issues across healthcare real estate. Cell Tower REITs showed incremental improvement, with two guidance raises and average expected AFFO growth improving to 1.2%, but domestic carrier activity remains well below prior 5G-cycle levels. Strip Center REITs delivered another strong operating quarter, with seven guidance raises, roughly 16% leasing spreads, and occupancy near 96%, but elevated expectations and higher rates drove broadly negative stock reactions. Casino REITs remained dependable, with both companies modestly raising AFFO guidance, while Cold Storage REITs continued to show stabilization after a difficult 2025 but still need several quarters of consistent execution to rebuild investor confidence. Among individual names, the steepest earnings-season declines were concentrated in challenged credit, legal, and/or balance-sheet stories, including JBG Smith (JBGS), Community Healthcare (CHCT), Acres Realty (ACR) and Claros Mortgage (CMTG).
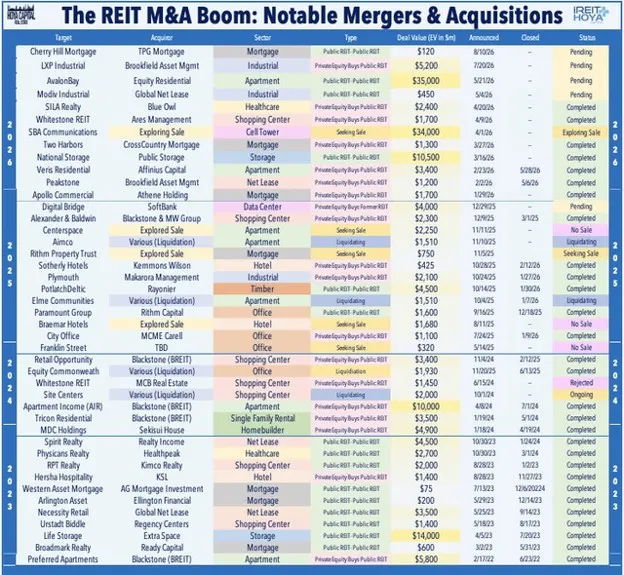
M&A news again stole some of the thunder from earnings season, reinforcing the ongoing “REIT Exodus” theme and the persistent gap between public- and private-market real estate valuations. LXP Industrial (LXP) surged roughly 10% during earnings season after agreeing to be acquired by Brookfield Asset Management (BAM)in a deal valued at over $5B, while Cherry Hill Mortgage (CHMI) rallied 27% after agreeing to be acquired by fellow residential mREIT TPG Mortgage (MITT) in a smaller cash-and-stock transaction valued at roughly $118M. The pair of deals represented the 10th and 11th acquisition of a publicly traded REIT announced this year. The recent deal flow reinforces a central REIT theme: strategic buyers continue to step in where public markets have been slow to fully value real estate platforms, while the reopening IPO pipeline suggests that the public market is not closed - just more selective. For public REIT investors, that private-market bid is increasingly relevant not just as a source of takeout premiums, but as a valuation anchor for discounted REITs with durable cash flows, high-quality assets, and credible paths to balance-sheet repair or external growth. Below, we discuss the sector-level Losers of REIT Earnings Season.
Loser #1: Commercial Mortgage REITs (Final Grade: C)
Negatives: Commercial mREITs remained the clear trouble spot this earnings season, with average book value declining 4.9% and adjusted EPS falling 30% sequentially. Granite Point, Claros, KKR Real Estate, ACRES, and Ready Capital posted particularly large book-value declines, while credit provisions remained elevated at Blackstone Mortgage. Stress remained concentrated in challenged office, multifamily bridge, and life-science loans, including several San Diego and other lab-related exposures that required sizable marks or restructurings. Troubled assets continue moving toward market-clearing values, and dividend coverage remains stretched across much of the group.
Positives: Several portfolios showed signs of stabilization beneath the weak headline numbers, with Franklin BSP and Ladder posting modest book-value gains and transaction liquidity gradually improving across commercial real estate. Loan resolutions are increasingly converting uncertainty into realized values, while several heavily discounted stocks rallied as investors looked through near-term write-downs toward cleaner balance sheets and better earnings visibility once legacy problem loans are resolved.
Best Performer: Ready Capital (RC)
Worst Performer: ACRES Realty (ACR)
Loser #2: Apartment (Final Grade: B-)
Negatives: Full-year earnings expectations remained somewhat softer as elevated completions continue working through high-supply Sunbelt markets. The weakness was more company-specific than sector-wide, led by NexPoint Residential, where higher interest costs drove a sizable guidance cut, and Centerspace, where planned dispositions and restructuring weighed on expected earnings. New-lease pricing remains negative across several Sunbelt portfolios, concessions are still elevated in the most supply-heavy markets, and occupancy gains remain uneven. The recovery in blended rents is encouraging, but still too recent to materially lift 2026 earnings growth.
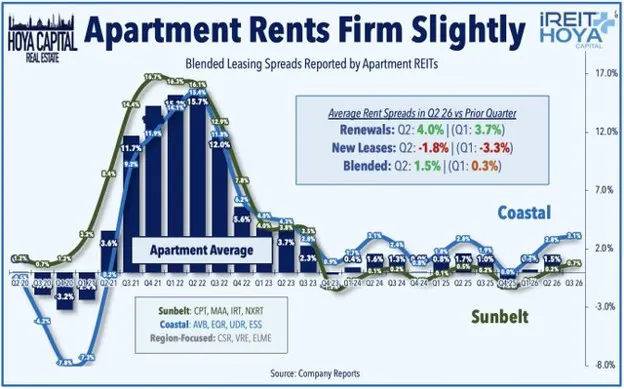
Positives: Apartment fundamentals continued to improve through the quarter, particularly in the high-frequency leasing data. July blended rent growth accelerated as Sunbelt new-lease declines narrowed and Coastal markets remained firm, while renewal growth held near 4%. Construction starts have also fallen sharply, setting up a considerably better supply backdrop for 2027. Essex, AvalonBay, and Equity Residential continued to lead on pricing, while UDR raised its full-year outlook.
Best Performer: Clipper Realty (CLPR)
Worst Performer: NexPoint Residential (NXRT)
Loser #3: Farmland (Final Grade: B)
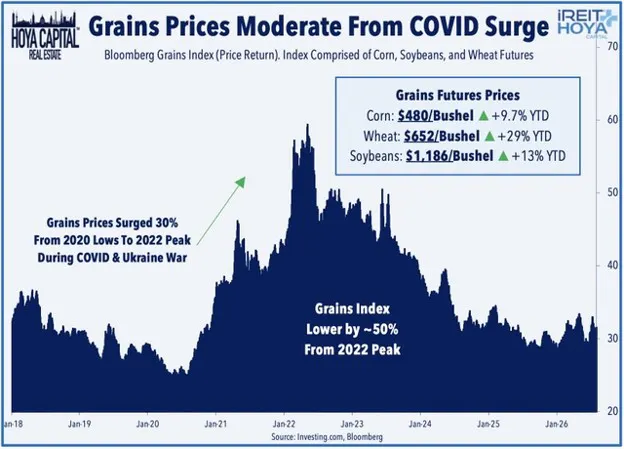
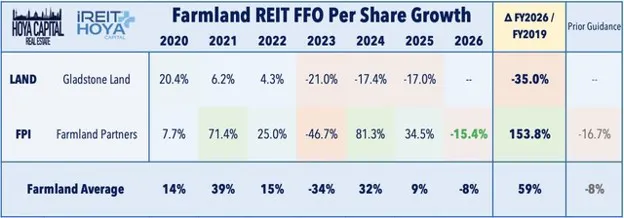
Negatives: Earnings remain pressured by lower crop profitability, vacant or repositioned farms, and tenant-specific issues, while revenue recognition can be highly seasonal and volatile. FPI still expects a double-digit FFO decline, and LAND continues shifting several challenged properties toward participation-based arrangements that push more earnings into the fourth quarter. Weather, water availability, crop pricing, and tenant credit remain persistent risks that make the recovery less straightforward than in most traditional property sectors.
Positives: The commodity backdrop improved during Q2, with stronger crop pricing providing a more favorable setup entering the second half. Gladstone Land cited materially better almond and pistachio pricing, while cash lease revenue increased and quarterly AFFO losses narrowed substantially from last year. Farmland Partners also modestly improved its full-year FFO outlook, while lower interest expense, strong liquidity, and ongoing lease restructurings provide a path toward better earnings as challenged farms are repositioned.
Best Performer: Farmland Partners (FPI)
Worst Performer: Gladstone Land (LAND)
Loser #4: Residential mREITs (Final Grade: B)
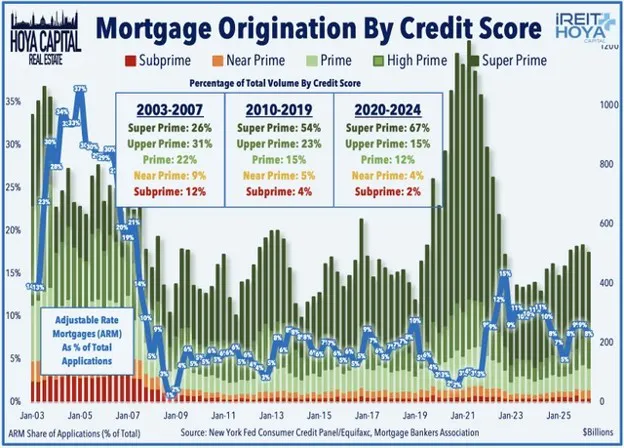
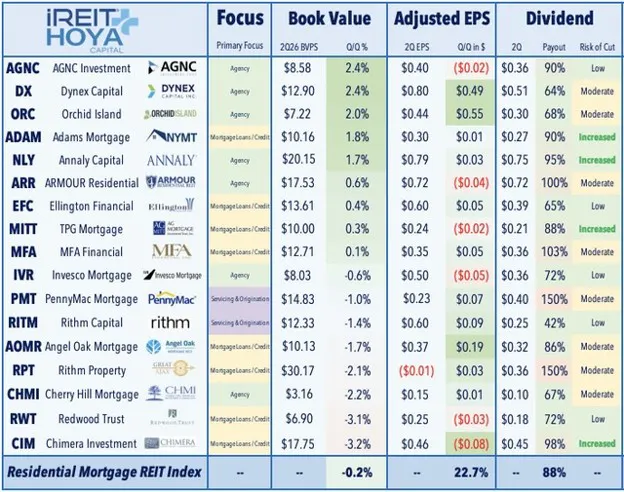
Negatives: Average book value still slipped modestly, with results varying considerably by strategy. Credit-oriented and servicing-heavy platforms generally lagged Agency-focused peers, while dividend coverage remains stretched at several smaller names. Rate volatility, hedging costs, prepayments, leverage, and mortgage-spread movements continue to produce significant quarterly earnings swings, leaving the group highly sensitive to changes in the yield curve even when underlying credit conditions remain relatively stable.
Positives: Residential mREIT fundamentals were considerably steadier than the stock-price dispersion suggested. Agency-focused portfolios generally performed well, led by AGNC, Dynex, Orchid Island, and Annaly, while aggregate adjusted earnings rebounded sharply from Q1 and liquidity remained healthy. The absence of any broad funding or credit event despite considerable rate volatility was encouraging, while the Cherry Hill takeout provided another indication of strategic value within discounted mortgage REIT portfolios.
Best Performer: Cherry Hill Mortgage (CHMI)
Worst Performer: TPG Mortgage (MITT)
Loser #5: Medical Office (Final Grade: B+)
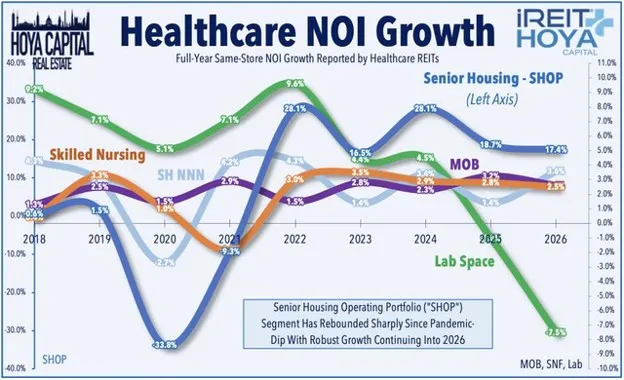
Negatives: Results remained uneven among smaller platforms, most notably Community Healthcare, which cut its dividend 31% while redirecting capital toward acquisitions and redevelopment. Chiron, formerly Global Medical REIT, is undergoing a significant strategic transition toward senior housing, creating near-term dilution and execution risk. Medical Properties Trust showed some operating stabilization, but its balance-sheet repair remains costly, highlighted by a roughly $2.4B secured refinancing carrying a 9.25% coupon.
Positives: Traditional MOB fundamentals remained constructive, with Healthcare Realty raising its earnings outlook and same-store NOI expectations while Healthpeak narrowed its expected FFO decline. Leasing, occupancy, and tenant-retention trends generally improved, and several platforms are beginning to emerge from multi-year portfolio restructuring and capital-allocation programs. MOB demand remains relatively defensive, while limited new construction continues to support well-located outpatient assets.
Best Performer: Global Medical / Chiron (XRN)
Worst Performer: Community Healthcare Trust (CHCT)
Loser #6: Lab Space (Final Grade: B-)
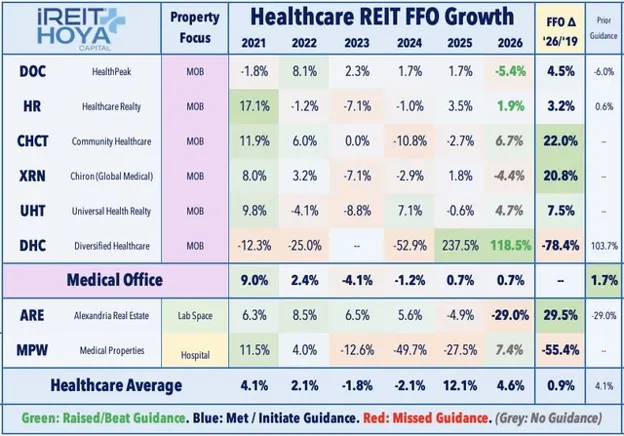
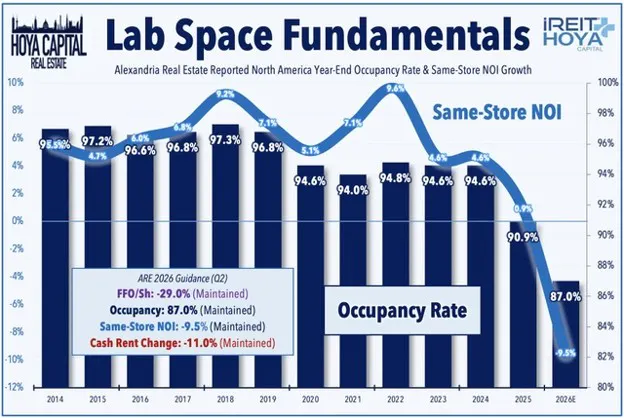
Negatives: Alexandria maintained a weak 2026 outlook, calling for a 29% FFO decline, 9.5% same-store NOI contraction, 11% negative cash leasing spreads, and year-end occupancy of 87%. Elevated move-outs, excess availability, weak tenant expansion, subdued biotech funding, and significant development supply push the recovery timeline further into the future.
Positives: Alexandria’s guidance did not deteriorate further during Q2, while development leasing and capital recycling provide some avenues for eventual stabilization. The long-term demand case around biotechnology, pharmaceutical research, and premier innovation clusters remains intact, but a sustained recovery likely requires better tenant funding conditions and meaningful absorption of existing vacancy.
Steady Performers This Earnings Season
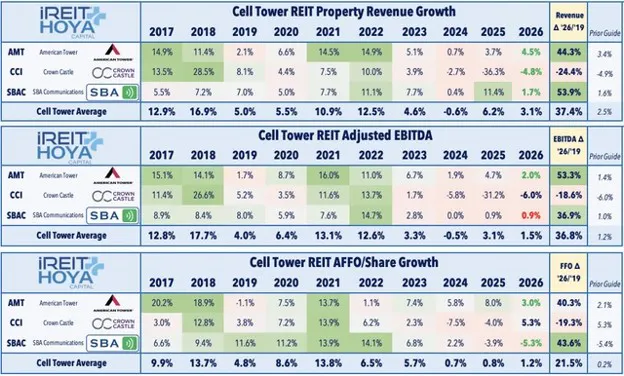
Cell Towers (Final Grade: B)
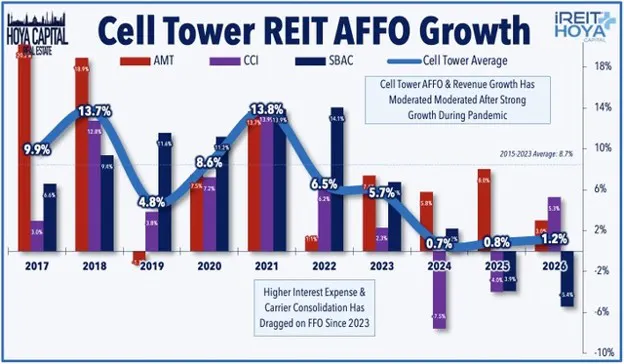
Positives: Tower fundamentals continued to stabilize, with two of the three major REITs improving guidance and average expected AFFO growth returning to positive territory. American Tower raised its outlook as organic trends improved, while Crown Castle maintained expectations for a solid AFFO rebound as its strategic repositioning progresses. Carrier spending is gradually shifting back toward capacity upgrades and densification, providing a better backdrop than the sharp post-5G slowdown of the past several years.
Negatives: Growth remains well below historical norms and there is still no major domestic deployment cycle capable of restoring prior AFFO growth rates. SBA Communications continues to expect an earnings decline, while DISH-related churn remains a drag across domestic portfolios. Higher interest expense, elevated leverage, and renewed Treasury pressure also continue to weigh on the long-duration valuation profile of the tower business.
Best Performer: American Tower (AMT)
Worst Performer: Crown Castle (CCI)
Strip Centers (Final Grade: B+)
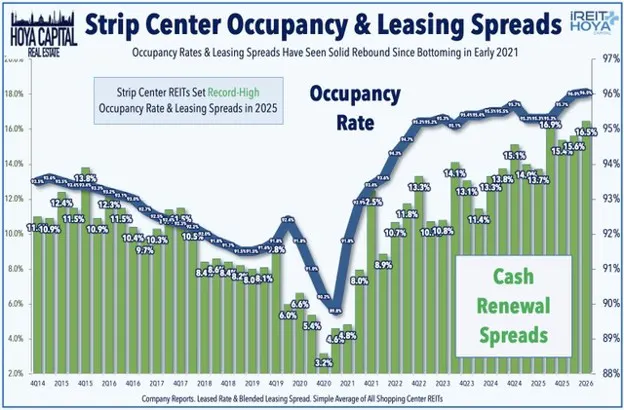
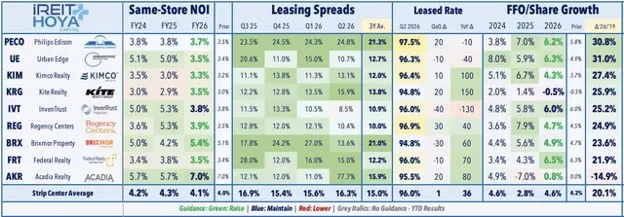
Positives: Fundamentals remained excellent, with seven guidance raises, leasing spreads above 16%, and occupancy near 96%. Tight new supply and strong retailer demand continue to support landlord pricing power, while sizable signed-not-open pipelines provide additional embedded NOI growth. Brixmor remained among the leaders on same-store NOI growth, while Kimco and Federal Realty also raised dividends during earnings season.
Negatives: After several years of strong performance, another solid quarter was not enough to generate meaningful stock-price upside, particularly as Treasury yields moved higher. Leasing spreads are unlikely to remain at current exceptional levels indefinitely, while weaker consumer spending could pressure lower-quality tenants. Even sector leaders declined during earnings season despite guidance raises, highlighting how much good news is already reflected in fundamentals and valuations.
Best Performer: Kimco Realty (KIM)
Worst Performer: InvenTrust Properties (IVT)
Casino (Final Grade: B+)
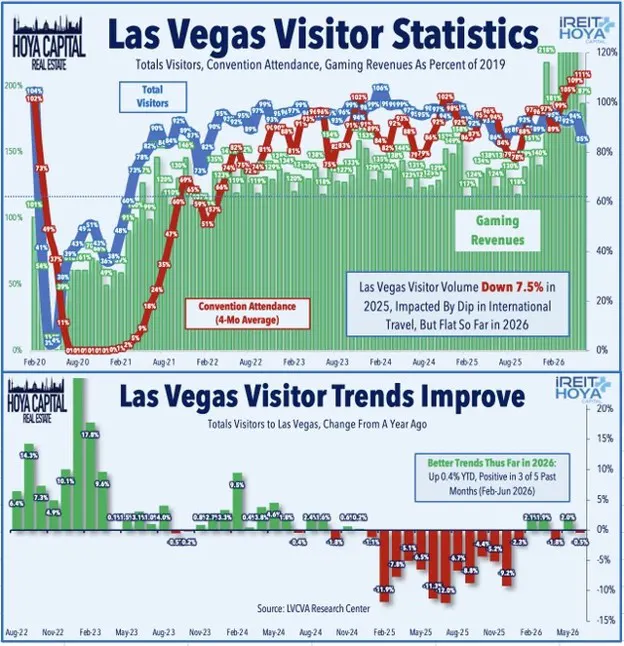
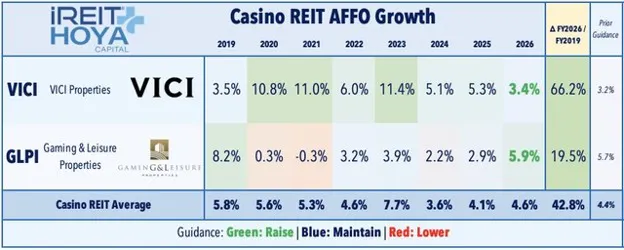
Positives: Casino REITs delivered another predictable quarter, with both VICI and Gaming & Leisure Properties modestly raising full-year AFFO guidance. Long lease terms, contractual escalators, and healthy tenant rent coverage continue to provide highly visible cash flows, while both platforms retain meaningful external-growth opportunities. GLPI remains particularly active deploying capital at attractive initial yields, supporting steady earnings growth even without a major improvement in underlying gaming fundamentals.
Negatives: External growth remains an important part of the model, leaving both companies sensitive to transaction availability and cost of capital. Tenant concentration and regional gaming trends require continued monitoring, while operators remain exposed to discretionary consumer spending and competitive supply in select markets. The essentially flat stock performance during earnings season reflected a quarter that was solid and slightly better than expected, but lacked a major catalyst or operating inflection.
Best Performer: VICI Properties (VICI)
Worst Performer: Gaming & Leisure Properties (GLPI)
Cold Storage (Final Grade: B+)
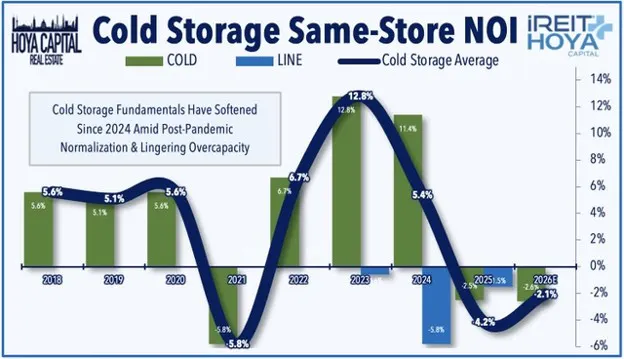
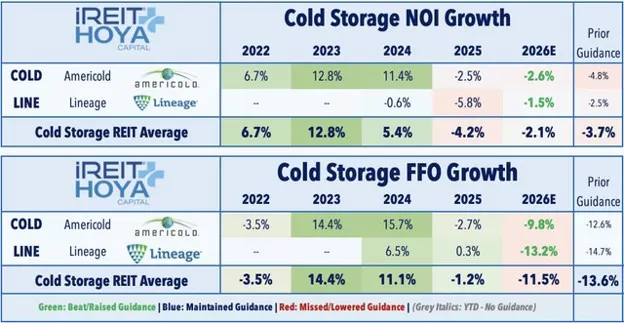
Positives: Both major Cold Storage REITs raised their outlooks, extending the gradual recovery from a difficult 2025. Americold improved its AFFO and same-store NOI expectations as customer wins and share gains helped narrow the occupancy gap, while Lineage also raised guidance as physical occupancy turned positive year-over-year. Portfolio actions, lower capital spending, and Americold’s large EQT joint venture should also improve balance-sheet flexibility and earnings visibility.
Negatives: The recovery remains early and underlying food volumes have not fully normalized, leaving both companies sensitive to inventory cycles, customer consolidation, and trade flows. Caution is warranted after repeated disappointments during 2024-2025, and both stocks slipped despite the guidance raises. Warehouse utilization and throughput still need to improve further before the sector can return to normalized earnings growth, making several quarters of consistent execution necessary to rebuild confidence.
Best Performer: Lineage (LINE)
Worst Performer: Americold (COLD)
Cannabis (Final Grade: B-)
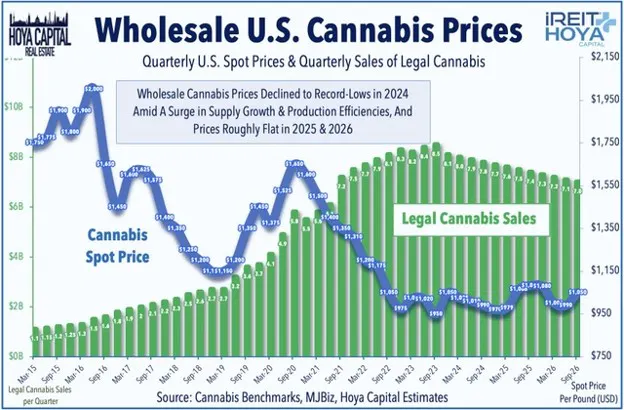
Positives: Leasing activity improved across both major Cannabis REITs, while conservative balance sheets provide meaningful flexibility to work through tenant problems. Innovaive Industrial made progress re-leasing troubled properties and has agreements covering additional former 4Front space, while NewLake Capital maintained comfortable dividend coverage, very low leverage, and an increasingly active investment pipeline. NLCP also reported improving discussions around its remaining vacant cultivation facilities.
Negatives: Tenant credit remains the defining issue across the sector. IIPR’s quarterly FFO remained below its dividend, occupancy slipped, and several operator restructurings continue to create rent-collection uncertainty despite recent leasing progress. NLCP still has three vacant cultivation properties, while limited tenant diversification makes both portfolios unusually sensitive to individual operator performance. IIPR’s sharp earnings-season decline reflected continued skepticism that recent re-leasing activity has fully resolved the sector’s credit problems.
Best Performer: NewLake Capital (NLCP)
Worst Performer: Innovative Industrial (IIPR)
Self-Storage (Final Grade: B+)
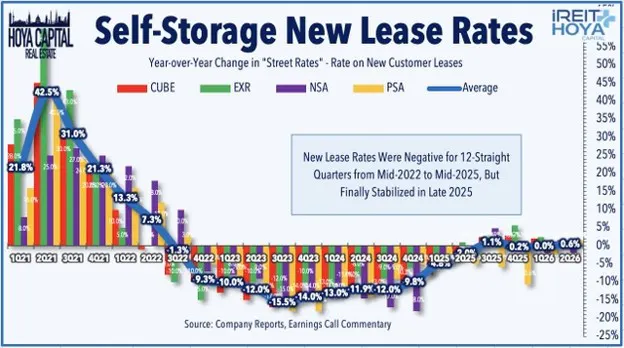
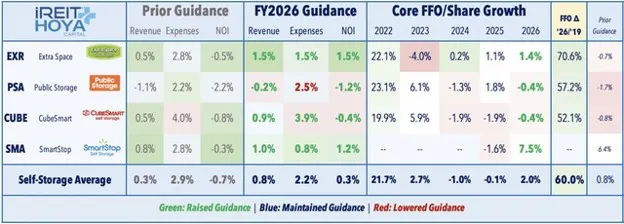
Positives: Self-Storage produced one of the more encouraging cyclical inflections of earnings season, with all four guidance-providing REITs raising outlooks after several quarters of downward revisions. New-lease pricing finally turned positive, occupancy stabilized, and expense trends improved. Extra Space moved from an expected earnings decline to growth, Public Storage and CubeSmart narrowed their expected contractions, and SmartStop raised an already-strong growth outlook.
Negatives: The recovery remains modest and housing turnover is still historically depressed, limiting move-in demand and broader pricing power. Several REITs continue to expect flat-to-negative earnings growth despite the guidance improvements, while occupancy remains below prior-cycle peaks. A more durable acceleration likely requires improved home sales, mobility, and household formation, leaving the sector dependent on a housing-market recovery that has been repeatedly delayed by elevated mortgage rates.
Best Performer: SmartStop Self Storage (SMA)
Worst Performer: Public Storage (PSA)
Earnings Recap: Strong Results, Uneven Rewards
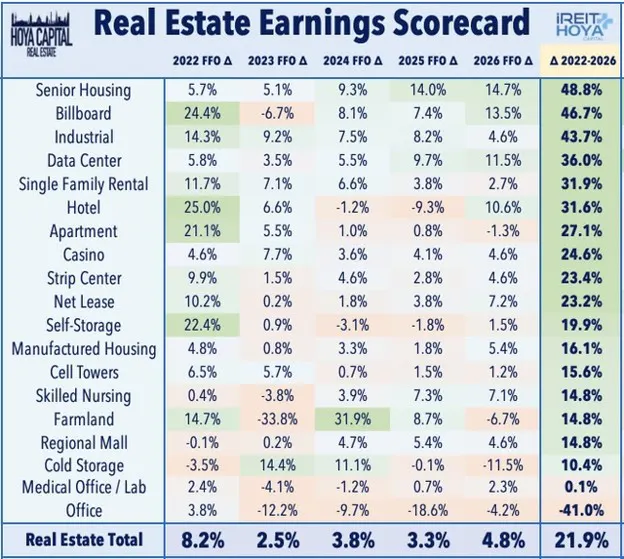
REIT earnings results were exceptionally strong, with 83 REITs - or 83% of guidance-providing equity REITs - raising their outlooks, just four lowering guidance, and the average outlook increasing 1.4%. Part 2 focused on the relatively small group of laggards and in-line performers, where weakness was often more company-specific than sector-wide. Commercial Mortgage REITs remained the clearest trouble spot, with book values down 4.9% amid continued multifamily, office, and life-science credit stress, while Lab Space remained firmly in a prolonged trough. Apartments were more mixed than weak, with near-term Sunbelt supply pressure offset by improving leasing trends and a better 2027 setup. Residential Mortgage REITs were comparatively stable, while Farmland showed a somewhat better commodity backdrop despite lingering tenant issues. Elsewhere, Medical Office, Cell Towers, Strip Centers, Casino, Cold Storage, Cannabis, and Self-Storage generally showed stable or improving fundamentals, while several of the sharpest stock declines reflected one-off issues at JBG Smith, Empire State Realty, and Community Healthcare. M&A also remained a key theme, with the LXP Industrial and Cherry Hill Mortgage takeouts reinforcing the private-market bid for discounted public REITs.
Disclosure: Hoya Capital Real Estate advises two Exchange-Traded Funds listed on the NYSE. In addition to any long positions listed below, Hoya Capital is long all components in the Hoya Capital Housing 100 Index and in the Hoya Capital High Dividend Yield Index. Index definitions and a complete list of holdings are available on our website.
About the Author
David Auerbach boasts over two decades of experience in the securities industry, specializing as an institutional trader with a focus on Real Estate Investment Trusts (REITs), Equity and Preferred stocks, MLPs, ETFs, and Closed End Funds.
Based in Dallas, TX throughout his entire career, David currently serves as the Chief Investment Officer for Hoya Capital, managing the Hoya Housing 100 ETF (Ticker: HOMZ) and The High Yield Dividend ETF (Ticker: RIET). Previously, David held the position of Managing Director at Armada ETF Advisors, the sub-advisor for the Residential REIT ETF (Ticker: HAUS) and The Private Real Estate Strategy via Liquid REITs ETF (Ticker: PRVT).
Additionally, he acts as a consultant with IRRealized, LLC, focusing on corporate access in the REIT industry. David's industry journey includes roles at World Equity Group, Esposito Securities, and Green Street Advisors where he got his start in the REIT industry.
At Esposito Securities, he played a crucial role in building the REIT/Real Estate platform and worked extensively with institutional investors, Equity REITs, and ETF issuers.
Throughout his career, David has been quoted by reputable publications such as Bloomberg, WSJ, Financial Times, REIT.com, and GlobeSt.com. He has also made notable appearances as a featured guest on networks like Yahoo Finance, TD Ameritrade, and Bloomberg.
David holds a BBA in Finance from the University of Texas at Austin (May 1999) and an MBA in Finance from Southern Methodist University (May 2005). He maintains FINRA Series 7, 24, 55, and 63 registrations.
In his leisure time, David is an avid traveler, often found crisscrossing the country in pursuit of attending as many Phish concerts as possible.
Disclaimer
Please note this article is for information purposes only and does not in any way constitute investment advice. It is essential that you seek advice from a registered financial professional prior to making any investment decision.

Latest ETF News
See all ETF newsHow Much ETF Infrastructure Do You Really Need?


Are ETFs Getting Too Complicated? Not Necessarily, But Complexity Has a Cost

Form 4 Has 20 Transaction Codes. None Say "Section 351 ETF Swap"


Who Really Owns a White-Label ETF?

What If a Futures-Based ETF Never Had to Roll Again?

How Do You Build a Winning ETF Business?


 Advantages of ETFs over Mutual Funds1/6
Lower Costs
In this guide, we'll explore the advantages of ETFs over mutual funds, giving you valuable insights into why ETFs have gained significant popularity among investors like yourself.
Leveraged ETFs: Unlocking the Potential for Amplified Returns1/6
Understanding Leveraged ETFs
Explore leveraged ETFs: potential for amplified returns & risks. 5 ETFs to consider across equities, commodities & fixed income.
What is a Leveraged ETF?1/6
Introducing Leveraged and Inverse ETFs
In this guide, we'll dive into the world of leveraged ETFs, exploring their definition, mechanics, potential risks, and rewards.
Recent educational content

ETF Trends
ETF Industry KPIs October 5, 2026
This week’s KPI data overview highlights key metrics and trends shaping the ETF landscape.

ETF Trends
ETF Industry KPIs September 28, 2026
This week’s KPI data overview highlights key metrics and trends shaping the ETF landscape.
ETF Trends
ETF Industry KPIs September 22, 2026
This week’s KPI data overview highlights key metrics and trends shaping the ETF landscape.

First Look ETF
First Look ETF: Income, Corporate Arbitrage, and Growth and Value Investing
First Look ETF September 2026: iCapital, Mast Investments and North Square unpack new ETFs targeting monthly income, merger arbitrage and complementary growth and value exposure.

Browse all educational columns



Build and Analyze Your ETF Portfolio Like a Pro
Create your own ETF portfolio in minutes and instantly see allocations, exposures, performance, and risk. Visualize diversification across asset classes, regions, and sectors. Stress-test ideas, compare benchmarks, and refine your strategy with professional-grade analytics.
