Open Now: The Global ETF Survey Take the Survey →

How to avoid the capital gains mutual funds distribute even in down markets
Cap gain dividends result from mutual funds incurring gains during the year on investment transactions. You might think that with markets down significantly, there would not be any gains to pay out.


Keep up with what matters in ETFs
Get timely ETF insights, market trends, and top ideas straight to your inbox.
Your newsletter subscriptions with us are subject to ETF Central's Privacy Policy and Terms and Conditions.
The pain of poor absolute investment returns extends across mutual funds, ETFs, and separately managed accounts.[1] But it could get worse for mutual fund investors this fall when mutual funds begin releasing information on capital gains dividends to be paid out prior to yearend.
Cap gain dividends result from mutual funds incurring gains during the year on investment transactions. You might think that with markets down significantly, there would not be any gains to pay out. Unfortunately, history shows that funds pay out capital gains dividends even when markets are down. And that means additional taxes for the funds’ shareholders.
Consider tax-loss harvesting now to avoid potential cap gains distributions and reposition portfolios with more tax-efficient ETFs.[2]
The ETF Industry Is Evolving Fast
From AI infrastructure to active strategies, the ETF landscape is shifting. Share your perspective in the 7th Annual Global ETF Survey and get exclusive early access to the final report.
How Broad Are Mutual Fund Losses?
As of the end of July, 97% of all mutual funds, active and passive, had negative returns. The losses were slightly more plentiful in fixed income, given how rates have risen and credit spreads have widened in 2022. So far, 99% of fixed income mutual funds have losses, compared to 96% of equity funds.[3]
Dating back to 2001, this is the worst year for performance — even worse than during the Great Financial Crisis in 2008. While year-to-date equity returns are not worse than 2008’s, the current significant weakness in fixed income pushes the total number of funds with losses in 2022 29 percentage points higher than in 2008.
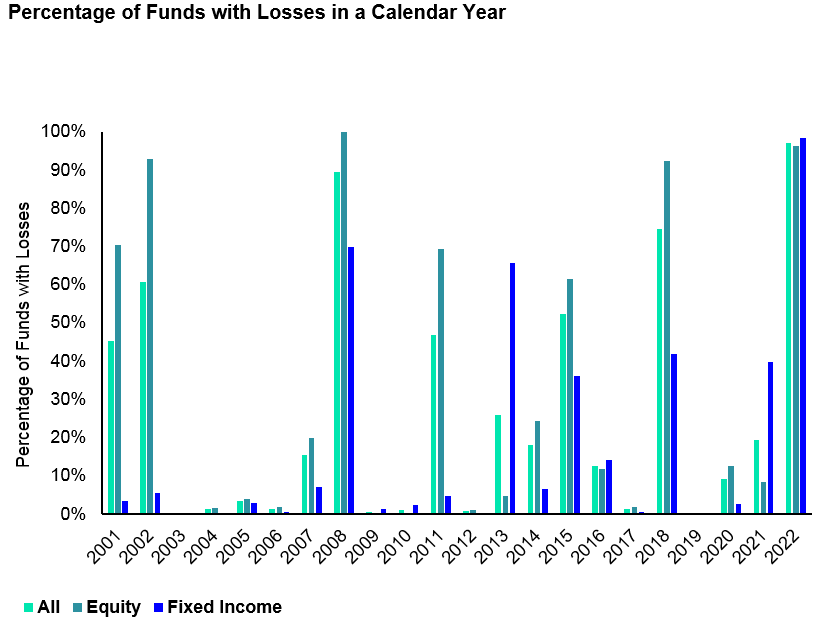
Source: Morningstar, as of July 31, 2022, based on SPDR Americas Research Calculations. Past performance is not reliable indicator of future performance.
As of the end of July, 60% of active mutual fund managers have underperformed their stated benchmark. This is the highest underperformance rate since 2018 — and higher than the 53% historical average of managers underperforming dating back to 2001. And similar to the absolute returns shown above, fixed income strategies have had the weaker results. Nearly 70% of all active fixed income managers have underperformed their benchmark so far this year, well above the historical average of 57%.[4]

Source: Morningstar, as of July 31, 2022, based on SPDR Americas Research Calculations. Past performance is not a reliable indicator of future performance.
How Many Mutual Funds Might Distribute Cap Gains This Year?
There have been global equity losses in seven of the past 21 years.[5] In the more recent downturns in 2018, 2015, and 2011, the fund industry was more diverse than it was in the dot-com and Great Financial Crisis eras. For example, in 2008 there were 3,000 funds, but now there are more 5,400.[6]
In each of those three years, the percentage of mutual funds paying capital gains – active, passive, and across asset classes – was greater than the historical average, as shown below. Examining those three years and 2020, which also featured a brief bear market, along with fund flow patterns points to a potentially higher number of mutual funds distributing capital gains this year.

Mutual Fund Outflows Can Increase Cap Gains Distributions
Given mutual funds’ subpar returns come at a higher cost than with ETFs,[7] it’s no surprise that mutual fund flows have been significantly negative through July. As shown below, active mutual funds have experienced a total of $491 billion in outflows, from both active equity and bond funds. Active ETFs have had inflows, however, as have indexed mutual funds and passive ETFs.

Source: Morningstar, as of July 31, 2022 based on SPDR Americas Research Calculations. Past performance is not reliable indicator of future performance.
These substantial outflows from active mutual funds — along with increased trading in a volatile market — increase the likelihood of capital gains distributions this year. That’s because whenever a redemption occurs, mutual funds must sell securities to raise cash, creating capital gains distributions for investors still holding the fund. That is not the case with ETFs. An ETF redemption triggers an in-kind exchange process that usually does not cause a taxable event for investors still in the fund.
In the five years since 2001 when mutual funds have had net outflows, 53% of funds on average paid cap gains, compared to 47% overall. For active mutual funds alone, the average increases to 54% in years with outflows, compared to 48% overall.[8]
Could 2022 Follow 2018?
Because markets nearly fell into a bear market and rates rose in 2018, it seems the most appropriate comparable for 2022. And, as shown earlier, absolute returns were weak in 2018, with greater than 75% of funds posting negative returns. The relative returns for active mutual funds in 2018 were also similar to what we are seeing in 2022; more than 66% of active strategies underperformed their benchmark in 2018.
In 2018, 61% of funds paid cap gains and 69% of active funds paid cap gains. Thirty percent of funds had negative absolute returns, negative relative returns, and a cap gain distribution.[9] Given 2022’s similarities to 2018, we might expect nearly one-third of today’s active mutual funds to have absolute losses and negative excess return — and distribute capital gains before the year is over.
Tax-Efficient ETFs Generally Don’t Distribute Capital Gains
Exchange traded funds (ETFs) inherent tax efficiency stems from their capacity to effect in-kind creation/redemption transactions and investors’ ability to buy and sell shares on the secondary market and leave the underlying fund unaffected. In fact, so far in 2022 for every $7 traded in ETFs on the secondary market, only $1 has hit the primary market (the fund).[10]
Consequently, the percentage of mutual funds paying capital gains dividends in a given calendar year is, on average, 11 times greater than the percentage of ETFs that pay capital gains.

ETFs’ tax efficiency extends across active and passive mandates. While active ETFs pay out more dividends than passive ETFs, they still pay less than half of what active mutual funds pay. Over the past five years, an average of 20% of active ETFs have distributed cap gains, compared to 60% of active mutual funds. The ETF average is somewhat skewed by the fact that in the early years, in 2011 for, there were less than 50 active ETF strategies and now there are more than 900 funds.[11]
Analyzing distributions by asset class, active equity (52%) and active fixed income (33%) mutual funds have historically had higher cap gain payer percentages than active equity (20%) and active fixed income (24%) ETFs.[12] The differential is more pronounced for passive funds — 48% for active equity mutual fund active versus to 5% for active equity ETFs and 52% for active bond mutual funds versus 12% for active bond ETFs.[13]

Keeping the Great Migration to ETFs Going
If you own an active mutual fund that is down on the year, underperforming its benchmark, and has historically paid a capital gain, perhaps it’s time to consider cutting your losses before a bad situation gets worse.
Harvesting the loss from your portfolio and swapping into an indexed ETF could lower your portfolio costs and increase its tax efficiency. And, if you prefer an active ETF, the burgeoning active ETF marketplace has now reached $330 billion with more than 900 strategies to choose from.[14]
Bigger picture, if one-third of today’s active mutual funds do indeed have absolute losses, negative excess return, and capital gains distributions this year, that will likely accelerate the trend of investing in ETFs, both active and indexed.
Matthew J. Bartolini, CFA, CAIA, Head of SPDR Americas Research, State Street Global Advisors
Glossary
Capital Gains Dividend
A capital gain (or loss) is the difference between your purchase price and the value of the security when you sell it. A dividend is a payout to shareholders from the profits of a company that is authorized and declared by the board of directors.
Fixed Income
A type of investing, usually involving bills, notes or bonds, for which real return rates or periodic income is received at regular intervals and at reasonably predictable levels. Fixed income can also refer to a budgeting style that is based on fixed pension payments.
S&P Global BMI Index
Comprised of the S&P Developed BMI and S&P Emerging BMI, is a comprehensive, rules-based index measuring global stock market performance. The S&P Global BMI represents the only global index suite with a transparent, modular structure that has been fully float-adjusted since its inception in 1989.
Tax Loss Harvesting
A strategy designed offset capital gains tax liabilities by selling securities at a loss. Selling at a loss allows investors to accrue tax credits that can be matched with tax liabilities, thereby reducing an overall tax bill. The strategy is most often used to offset liabilities of short-term capital gains, which are taxed at a higher rate than long-term gains, i.e., gains on assets held a year or more.
Disclosure
The views expressed in this material are the views of the SPDR Research and Strategy team through the period ended August 19, 2022, and are subject to change based on market and other conditions. This document contains certain statements that may be deemed forward-looking statements. Please note that any such statements are not guarantees of any future performance and actual results or developments may differ materially from those projected.
The information provided does not constitute investment advice and it should not be relied on as such. It should not be considered a solicitation to buy or an offer to sell a security. It does not take into account any investor's particular investment objectives, strategies, tax status or investment horizon. You should consult your tax and financial advisor.
Unless otherwise noted, all data and statistical information were obtained from Bloomberg Finance, L.P. and SSGA as of August 19, 2022. Data in tables have been rounded to whole numbers, except for percentages, which have been rounded to the nearest tenth of a percent.
All information is from SSGA unless otherwise noted and has been obtained from sources believed to be reliable, but its accuracy is not guaranteed. There is no representation or warranty as to the current accuracy, reliability or completeness of, nor liability for, decisions based on such information and it should not be relied on as such.
Investing involves risk including the risk of loss of principal.
The whole or any part of this work may not be reproduced, copied or transmitted or any of its contents disclosed to third parties without SSGA’s express written consent.
Footnotes
[1] Morningstar as of July 31, 2022 based on SPDR Americas Research calculations
[2] Morningstar as of July 31, 2022 based on SPDR Americas Research calculations
[3] Morningstar as of July 31, 2022 based on SPDR Americas Research calculations
[4] Morningstar as of July 31, 2022 based on SPDR Americas Research calculations
[5] Bloomberg Finance L.P. as of August 19, 2022 based on SPDR Americas Research calculations of the S&P Global BMI Index
[6] Morningstar as of July 31, 2022 based on SPDR Americas Research calculations
[7] Morningstar as of July 31, 2022 based on SPDR Americas Research calculations
[8] Morningstar as of July 31, 2022 based on SPDR Americas Research calculations
[9] Morningstar as of July 31, 2022 based on SPDR Americas Research calculations
[10] Bloomberg Finance L.P. as of August 19, 2022 based on SPDR Americas Research calculations
[11] Bloomberg Finance L.P. as of August 19, 2022 based on SPDR Americas Research calculations
[12] Morningstar as of July 31, 2022 based on SPDR Americas Research calculations
[13] Morningstar as of July 31, 2022 based on SPDR Americas Research calculations
[14] Morningstar as of July 31, 2022 based on SPDR Americas Research calculations
Latest ETF News
See all ETF newsEquity Investing 101: Understanding U.S. Large-Cap Growth ETFs


Tony's ETF Buyer's Guide: Sector ETFs (Vanguard versus State Street SPDR)

Options Strategies in ETFs, Part 4: Put-Selling and Leverage

Options Strategies in ETFs, Part 3: Buffer ETFs


 Advantages of ETFs over Mutual Funds1/6
Lower Costs
In this guide, we'll explore the advantages of ETFs over mutual funds, giving you valuable insights into why ETFs have gained significant popularity among investors like yourself.
Leveraged ETFs: Unlocking the Potential for Amplified Returns1/6
Understanding Leveraged ETFs
Explore leveraged ETFs: potential for amplified returns & risks. 5 ETFs to consider across equities, commodities & fixed income.
What is a Leveraged ETF?1/6
Introducing Leveraged and Inverse ETFs
In this guide, we'll dive into the world of leveraged ETFs, exploring their definition, mechanics, potential risks, and rewards.
Recent educational content

Asset TV
The ETF Show - New Autism-Impact ETF Launched
Defiance ETFs has launched the first ETF, $ASD, focused on the autism ecosystem, investing in companies that provide services, products, and research related to autism and neurodivergence.


ETF Trends
ETF Industry KPIs June 1, 2026
The ETF Industry saw 22 New Launches, 1 Ticker Change and 1 closure last week.
ETF Trends
ETF Industry KPIs May 20, 2026
The ETF Industry saw 44 New Launches, 3 Mutual Fund Conversions and 9 closures last week.

Asset TV
The ETF Show - Politics Becomes Investable Trade through ETFs
Dan Weiskopf, Senior Portfolio Manager at Tidal Financial Group spoke with the ETF Show about Subversive ETFs that help investors trade like politicians.
Browse all educational columns

Active Trader Report: Use of Leveraged & Inverse ETFs Way Up
Direxion partnered with Compound Insights and Vanda to explore what’s driving the evolution of active trading — and how active traders are using leveraged and inverse funds across equities, single stocks, commodities, and volatility.
