Create, analyze, optimize your ETF portfolio. Start now →



February Crypto ETF Flows Fracture as US Outflows Mount and Altcoins Gain Ground
CoinDesk’s Joshua de Vos unpacks the major flows, top performers, and key trends that shaped February's U.S. crypto ETF market.


Keep up with what matters in ETFs
Get timely ETF insights, market trends, and top ideas straight to your inbox.
Your newsletter subscriptions with us are subject to ETF Central's Privacy Policy and Terms and Conditions.
February was the sharpest month for US-listed crypto ETF outflows since the current correction began, as price declines accelerated and investor redemptions more than doubled relative to January.
According to Trackinsight, US-domiciled crypto ETFs recorded $979.1M in net outflows during the month; compared to $455.4M in January, while total assets under management ended February at $105.4B.
Market performance reflected the deteriorating environment. The CoinDesk 20 Index (CD20) declined 16.82%, extending January's 13.32% drawdown, while the CoinDesk 5 Index (CD5) fell 16.05%. The narrowing gap between the two indices compared to prior months suggests that by February the pressure had become broad-based, with mega-cap assets offering diminishing relative shelter from the wider decline.
Crypto ETF Flows Rotate from Majors Toward Altcoins
Redemptions were again concentrated in the two dominant categories, though the pattern of divergence across the asset universe continued to widen.
- Bitcoin-linked ETFs recorded net outflows of $230.2M, while maintaining $100.3B in total AUM. Despite the outflow environment, Bitcoin ETFs retained their commanding position as the core holding within the US crypto ETF market,
- Ethereum-linked ETFs experienced $237.1M in net outflows, closing February with $14.8B in aggregate AUM. Notably, ETH outflows exceeded BTC outflows for the second consecutive month on a flow-relative-to-AUM basis; a notable reversal of the pattern that held for much of last year.
- Multi-asset products recorded $29.9M in net outflows, with diversified baskets maintaining $2.14B in total AUM, broadly in line with the risk-off tone seen across single-asset categories.
The more significant story in February was the continued resilience of altcoin-linked products.
- XRP-linked ETFs attracted $105.8M in inflows, ending the month with $2.51B in AUM.
- Solana-linked ETFs recorded $90.3M in inflows, closing February with $2.29B in total assets.
Both categories have now posted net inflows for two consecutive months, a consistency that points toward structural rather than speculative demand for certain altcoin vehicles. Sui-linked products also attracted $47M during the month, signaling a further broadening of the investable altcoin ETP universe within the US market.
Like what you're reading?
Stay in the loop — get the latest ETF insights: trends, analysis, and expert picks.
Leveraged Crypto ETFs Dominate February Inflows
The composition of inflows at the fund level offers an important qualifier to the headline outflow figure. February's largest individual gainers were almost exclusively leveraged and tactical products; a pattern that reflects short-term positioning rather than longer-term allocation.
The Volatility Shares 2x Ether ETF (ETHU) led all funds with $179.5M in inflows, closing February with $706.6M in AUM.
The Volatility Shares 2x Bitcoin Strategy ETF (BITX) followed with $166.9M, ending the month at $905.3M.
The Grayscale Bitcoin Mini Trust ETF (BTC) was the notable exception among the top gainers, attracting $163.8M and closing at $3.49B in AUM.
The largest funds by AUM were unchanged. The iShares Bitcoin Trust ETF (IBIT) continued to lead the market at $50.1B, followed by the Fidelity Wise Origin Bitcoin Fund (FBTC) at $12.3B and GBTC at $10.75B.
US Sells, World Buys. Crypto ETF Flows Diverge
US-listed products continued to dominate the global crypto ETF market in February. Despite net outflows of $979.1M, American-domiciled ETFs closed the month with $105.4B in AUM, retaining over 84% of global market share.
The more instructive global picture, however, is the degree to which non-US markets moved in the opposite direction.
Switzerland attracted $204.5M in inflows (AUM: $3.58B), Jersey drew $156.6M (AUM: $4.05B), and Canada added $139.3M – collectively absorbing over $500M during a month in which the US shed nearly $1B.
This geographic divergence was not visible at this scale in prior months, and may reflect growing conviction among European and Canadian allocators in using periods of US-driven weakness as entry points rather than signals to reduce exposure.
Outlook
February's data presents a nuanced picture. On the surface, the near-doubling of net outflows from January and the deepening price declines represent a continuation of the risk-off trend that has defined the year so far. Crypto-native market conditions reinforced this: combined spot and derivatives trading volumes on centralized exchanges declined 2.41% to $5.61T; the lowest level since October 2024, while open interest on centralized exchanges fell 28.4% to $83.2B; reflecting significant deleveraging across the market.
Yet several signals point toward a more differentiated picture heading into March. XRP and Solana ETFs have now posted consecutive months of inflows regardless of broader conditions. European and Canadian markets absorbed meaningful capital during a period of sustained US outflows. Additionally, the dominance of leveraged products in terms of net inflows suggests that a portion of the institutional market is actively positioning around volatility, rather than stepping back from it entirely.
Whether February proves to be the low point in the current outflow cycle will depend largely on how Bitcoin navigates its current range, and whether macro conditions stabilize sufficiently for directional allocators to re-engage in risk-on activity.
Data Sources:
TrackInsight (All ETF and ETP Data): https://www.trackinsight.com/services/data-services
CoinDesk (Bitcoin, CD20, CD80, Centralized Exchange Data): https://indices.coindesk.com/indices; https://www.coindesk.com/price
Disclaimer: TrackInsight considers flows from an ETF's perspective, treating the fund's first AUM upon listing as its initial inflow, which may differ from other sources that account for pre-listing activity or conversions.
Please note this article is for information purposes only and does not in any way constitute investment advice. It is essential that you seek advice from a registered financial professional prior to making any investment decision.


Latest ETF News
See all ETF newsCrypto ETFs Roar Back as U.S. Inflows Surge 13-Fold in August



Crypto ETFs Roar Back in March With $1.5B Inflow Surge

A Tough Start to 2026. January Outflows Hit Core Crypto ETFs



 Advantages of ETFs over Mutual Funds1/6
Lower Costs
In this guide, we'll explore the advantages of ETFs over mutual funds, giving you valuable insights into why ETFs have gained significant popularity among investors like yourself.
Leveraged ETFs: Unlocking the Potential for Amplified Returns1/6
Understanding Leveraged ETFs
Explore leveraged ETFs: potential for amplified returns & risks. 5 ETFs to consider across equities, commodities & fixed income.
What is a Leveraged ETF?1/6
Introducing Leveraged and Inverse ETFs
In this guide, we'll dive into the world of leveraged ETFs, exploring their definition, mechanics, potential risks, and rewards.
Recent educational content

ETF Trends
ETF Industry KPIs September 8, 2026
This week’s KPI data overview highlights key metrics and trends shaping the ETF landscape.

ETF Trends
ETF Industry KPIs August 31, 2026
This week’s KPI data overview highlights key metrics and trends shaping the ETF landscape.
ETF Trends
ETF Industry KPIs August 24, 2026
This week’s KPI data overview highlights key metrics and trends shaping the ETF landscape.
What’sTheFund
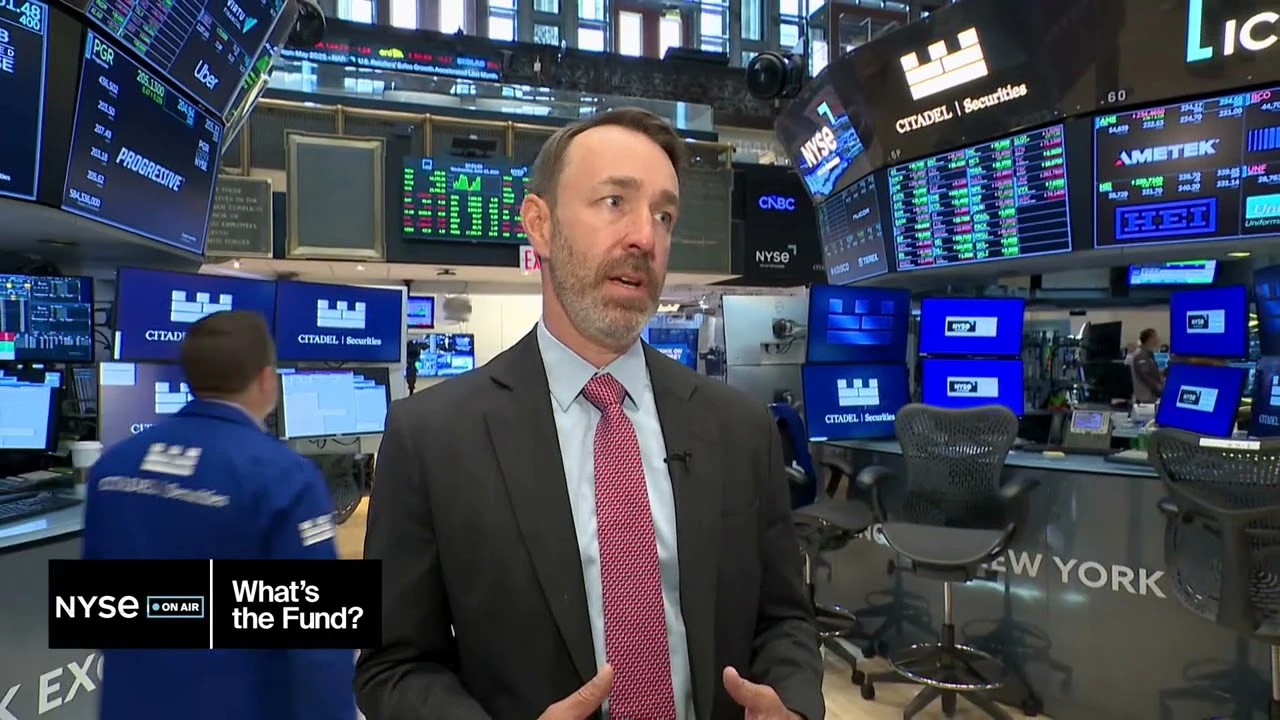
What's the Fund | Ocean Park Diversified Income ETF (DUKZ)
James St Aubin, Chief Investment Officer at Ocean Park Asset Management, discuss the DUKZ ETF, exposing investors to the whole spectrum of asset classes in the fixed income markets, through their rules-based process.

Browse all educational columns



Expert-Built ETF Portfolios, All in One Place
Don’t start from scratch. Discover ready-made ETF portfolios built by professionals to match different goals, timelines, and market views. Use them as inspiration or as a starting point for your own allocation.