Explore professionally built ETF model portfolios. Discover now →



ETF Model Portfolios: The Rental Property Replacement
This income-focused ETF allocation combines residential REITs, mortgage-backed securities, mortgage REITs, and homebuilders for pure-play housing exposure.


Keep up with what matters in ETFs
Get timely ETF insights, market trends, and top ideas straight to your inbox.
Your newsletter subscriptions with us are subject to ETF Central's Privacy Policy and Terms and Conditions.
For investors interested in rental properties, one of the first numbers worth examining is the capitalization rate, or cap rate. This measures a property's annual net operating income relative to its purchase price, providing a rough estimate of its unleveraged income yield.
Newmark's first-quarter 2026 survey, for example, estimated cap rates of 4.50% for Class A multifamily properties in downtown San Francisco, compared with 5.50% for Class B properties. In Seattle, Class A suburban apartments carried a 5.00% cap rate, while Class B suburban properties offered 5.75%.
The general pattern is that investors accept lower yields for newer, higher-quality properties in desirable locations, while older buildings and properties in less competitive markets tend to offer higher cap rates to compensate for additional risks. But there's something a cap rate doesn't tell you: how much work actually goes into owning and managing a rental property.
Even after accounting for operating expenses, landlords still need to deal with tenants, vacancies, maintenance, repairs, insurance, property taxes and potentially major capital expenditures. Hiring a property manager can reduce the workload, but that comes at an additional cost. And if you need to access your capital, selling a rental property is considerably more involved than selling a stock.
By comparison, owning a real estate ETF through a brokerage account requires virtually no ongoing management effort. Depending on the fund, investors can potentially receive comparable income yields alongside the prospect of capital appreciation, with substantially greater liquidity. Of course, ETF distributions aren't guaranteed, and real estate securities can experience considerable price volatility.
The other issue with simply buying a broad real estate sector ETF is that residential properties may represent only a fraction of the portfolio. Your typical diversified real estate investment trust (REIT) ETF includes substantial allocations to healthcare facilities, shopping centers, industrial warehouses and increasingly data centers. These are all legitimate real estate businesses, but their underlying economics can differ considerably from those of apartments, single-family rentals and other residential properties.
Fortunately, there are several more specialized ETFs that focus on residential real estate and the industries supporting it. Beyond landlords collecting rent, investors can gain exposure to mortgage-backed securities, mortgage REITs financing, and homebuilders supplying new housing.
That's what we're going to construct today using ETF Central's Model Portfolio Builder: a straightforward allocation using four iShares funds representing different components of the U.S. residential real estate market, with an emphasis on generating income while retaining potential for capital appreciation.
Global ETF Survey 2026 is Live!
With 1,790 new products launched by July 2026, choosing is harder than ever. Our Global ETF Survey 2026, built on 620 professional investors and allocators, shows how active, fixed income, options-based and thematic ETFs are reshaping fund selection.
The ETFs We're Going to Use
For this model portfolio, I'm starting with a 60% allocation to the iShares Residential and Multisector Real Estate ETF (REZ), which tracks the FTSE Nareit All Residential Capped Index. Despite its name, REZ isn't a pure-play residential real estate fund.
Multifamily residential REITs account for just 21.17% of the portfolio, while single-family residential REITs represent another 12.83%. Healthcare REITs make up just under half of its assets, with approximately 16% allocated to self-storage. There's a practical reason for this.
The publicly traded residential REIT universe is relatively small, particularly when compared with sectors such as industrial or retail real estate. Restricting an ETF exclusively to apartment and single-family rental operators would leave relatively few companies to choose from, making it difficult to maintain adequate diversification.
REZ addresses this by expanding its mandate to adjacent property types. Its 36 holdings therefore provide a broader interpretation of residential and demographic-driven real estate, although the healthcare allocation introduces exposure to businesses with very different economic drivers.
For our purposes, I think that's sufficient as a starting point. REZ charges a 0.48% expense ratio and offers a 30-day SEC yield of approximately 2.5%, providing some income alongside exposure to residential property ownership.
Next, I want to temper the portfolio's overall risk with a 20% allocation to the iShares MBS ETF
The fund primarily holds securities issued or guaranteed by Ginnie Mae, Fannie Mae and Freddie Mac. These agency MBS carry high credit quality, with the portfolio's average credit rating around AA, although the precise nature of the government backing differs among issuers.
MBB is also exceptionally affordable, charging an expense ratio of just 0.04%. Its 30-day SEC yield of approximately 4.4% provides considerably more income than REZ, making it useful for balancing the portfolio's relatively modest equity distributions.
However, mortgage-backed securities still carry interest rate and prepayment risk. Falling rates can encourage homeowners to refinance, returning principal to investors sooner than expected, while rising rates can extend the effective life of the underlying mortgages.
That leaves 20% of the portfolio unallocated. I'm splitting it evenly between two higher-risk exposures, each serving a different purpose. For capital appreciation potential, I'm assigning 10% to the iShares U.S. Home Construction ETF
ITB tracks the Dow Jones U.S. Select Home Construction Index, providing exposure to major publicly traded homebuilders alongside businesses supplying the residential construction industry. This gives the portfolio exposure to the development side of the housing market, complementing REZ's focus on existing real estate and MBB's exposure to mortgage financing.
Its leading holdings include all five of the major U.S. homebuilders: D.R. Horton, PulteGroup, Lennar, NVR and Toll Brothers. It also owns home improvement retailers such as Home Depot and Lowe's, along with building products suppliers including Sherwin-Williams.
ITB charges a 0.37% expense ratio, but its income contribution is relatively modest, with a 30-day SEC yield of approximately 0.94%. Instead, the attraction is its potential for capital appreciation. With a three-year equity beta of 1.39, ITB has historically exhibited substantially greater sensitivity to broad equity market movements. That could work in its favor during a housing recovery, although it also means potentially larger losses when mortgage rates rise or homebuyer demand weakens.
Finally, I'm allocating the remaining 10% to the iShares Mortgage Real Estate ETF
Mortgage REITs are better understood as specialized finance companies. Rather than primarily collecting rent from tenants, they invest in mortgages, mortgage-backed securities and other real estate debt instruments. Many finance these investments using borrowed money, attempting to earn a spread between the income generated by their assets and their funding costs.
That leverage can support unusually high distributions, but it also introduces substantial sensitivity to interest rates, credit conditions, financing costs and changes in the value of mortgage assets. REM currently offers a 30-day SEC yield of approximately 12.5% after its 0.48% expense ratio, making it by far the highest-yielding component of this allocation.
One important caveat is that REM isn't exclusively focused on residential mortgages. Its holdings include mortgage REITs with significant commercial real estate exposure, so investors are taking on additional risks beyond the residential housing market. Still, for a relatively small 10% allocation, I think it serves its intended purpose as an income kicker
How the Portfolio Performed
With the allocations established, the portfolio has a weighted-average expense ratio of 0.381% and a weighted-average 30-day SEC yield of approximately 4.16%, based on the latest reported yields for its four constituent ETFs. That works out to approximately $381 in annual fund expenses and $4,160 in annualized yield for every $100,000 invested.
Now, not every ETF model portfolio we construct is going to outperform its benchmark, and this one certainly hasn't. Back tested from 2022 onward, the rental property replacement portfolio has substantially lagged the S&P 500 Total Return Index.
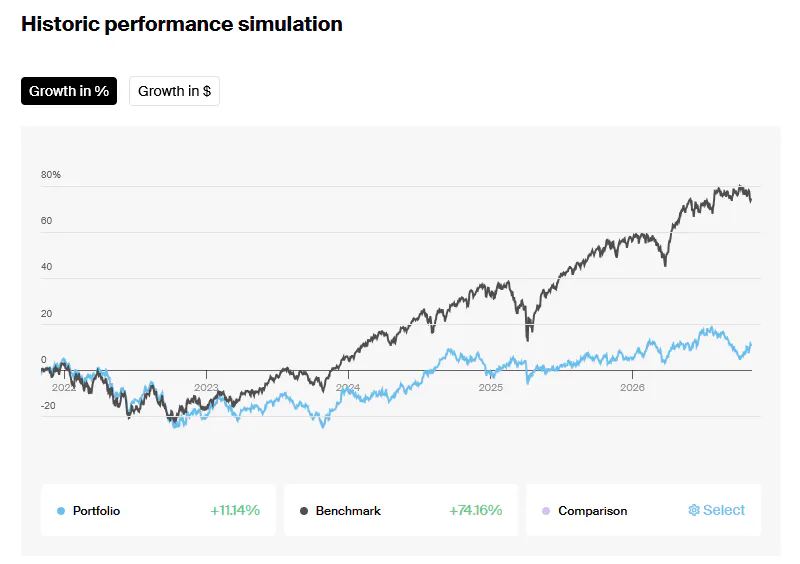
Admittedly, this has been a challenging period for virtually every component of the allocation. Residential REITs have faced higher financing costs and pressure on property valuations, while homebuilders have contended with elevated mortgage rates and deteriorating housing affordability. Meanwhile, agency mortgage-backed securities and mortgage REITs have been affected by rising interest rates, with the latter also facing pressure from funding costs and leverage.
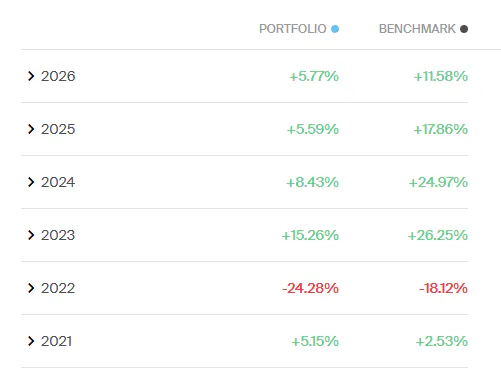
The annual performance figures illustrate these challenges. The portfolio's worst year was 2022, when the combination of high inflation and rising interest rates produced a larger loss than the S&P 500. This is an important qualification to the commonly repeated idea that real estate is an inflation hedge.
Over long periods, property values and rental income may rise alongside the general price level, providing some protection against inflation. In the short term, however, higher inflation can prompt central banks to raise interest rates, increasing financing costs and reducing the present value of future rental income. For publicly traded REITs and mortgage-related investments, those pressures can easily overwhelm any benefit from rising rents or property replacement costs.
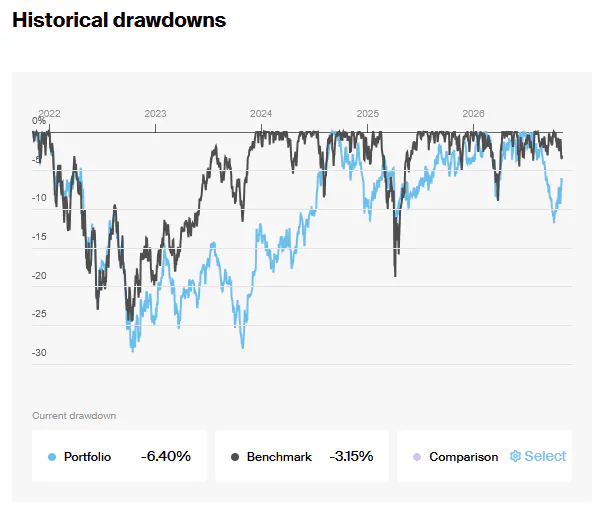
The portfolio's maximum drawdowns have also been considerable, despite its 20% allocation to fixed income. MBB's high credit quality provides some protection against default risk, but its duration exposure still makes it vulnerable to rising yields. Meanwhile, the remaining 80% of the portfolio consists of equity securities with considerable sensitivity to the housing cycle.
There's also an important psychological difference between owning this ETF portfolio and holding an actual rental property. Provided a landlord isn't overleveraged, facing negative cash flow or otherwise forced to sell, they can generally continue collecting rent and holding the property through unfavorable market conditions. Its market value may be fluctuating considerably in the background, but there isn't a brokerage screen updating the estimated selling price every second.
With publicly traded ETFs, that volatility is immediately visible. The advantage is that investors can liquidate their holdings relatively quickly without finding a buyer, negotiating a sale or paying real estate transaction costs. The disadvantage is having to tolerate daily market pricing, including potentially rapid declines during periods such as 2022.
Ultimately, I see this portfolio as a convenient, liquid way to obtain diversified exposure to the residential housing ecosystem without the operational responsibilities of being a landlord. It offers multiple sources of income and potential capital appreciation, but investors give up the direct control, property-level leverage decisions and insulation from daily market pricing that come with owning physical real estate.
Please note that this article reflects the author’s personal views and does not represent the opinions of the publication or its affiliates. It is for informational purposes only and does not constitute investment advice. It is essential to seek guidance from a registered financial professional before making any investment decisions.

Latest ETF News
See all ETF newsETF Model Portfolios: High Asset, Low Obsolescence (HALO)

ETF Model Portfolios: The Anti-Inflation and Rising Interest Rate Allocation

ETF Model Portfolios: The Geopolitical Risk Thematic Hedge





 Advantages of ETFs over Mutual Funds1/6
Lower Costs
In this guide, we'll explore the advantages of ETFs over mutual funds, giving you valuable insights into why ETFs have gained significant popularity among investors like yourself.
Leveraged ETFs: Unlocking the Potential for Amplified Returns1/6
Understanding Leveraged ETFs
Explore leveraged ETFs: potential for amplified returns & risks. 5 ETFs to consider across equities, commodities & fixed income.
What is a Leveraged ETF?1/6
Introducing Leveraged and Inverse ETFs
In this guide, we'll dive into the world of leveraged ETFs, exploring their definition, mechanics, potential risks, and rewards.
Recent educational content

ETF Trends
ETF Industry KPIs November 9, 2026
This week’s KPI data overview highlights key metrics and trends shaping the ETF landscape.

ETF Trends
ETF Industry KPIs November 3, 2026
This week’s KPI data overview highlights key metrics and trends shaping the ETF landscape.

First Look ETF
First Look ETF: Income, International, and Cash Flow ETFs
In this season 6 episode of First Look ETF, Stephanie Stanton @etfguide examines the latest ETF marketplace trends with NYSE and guests.

ETF Trends
ETF Industry KPIs October 5, 2026
This week’s KPI data overview highlights key metrics and trends shaping the ETF landscape.