Open Now: The Global ETF Survey Take the Survey →



ETF Market Weekly Trends: Gold Glitters, Bonds Boom, Equities Sink
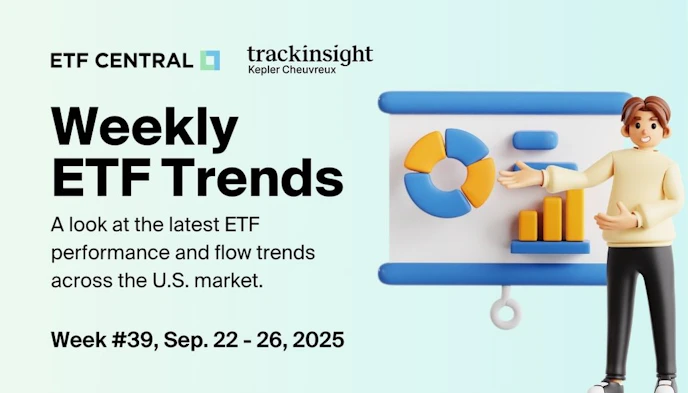
US-listed ETFs saw last week investors pour into bonds and commodities while retreating from US equities.

Keep up with what matters in ETFs
Get timely ETF insights, market trends, and top ideas straight to your inbox.
Your newsletter subscriptions with us are subject to ETF Central's Privacy Policy and Terms and Conditions.
According to data our partner Trackinsight, US-listed ETFs saw last week investors pour into bonds and commodities while retreating from US equities.
Like what you're reading?
Stay in the loop — get the latest ETF insights: trends, analysis, and expert picks.
Bonds and Gold Shine as Equities Lose Ground
The US ETF market experienced stark divergences last week as equity funds shed nearly $9.6 billion dollars, while fixed income attracted $9.1 billion and commodities took in $2.4 billion.
The rotation was underscored by a renewed preference for defensive exposures, with gold funds alone seeing almost $2 billion of inflows.
Crypto ETFs remained out of favor, losing more than half a billion in assets.
Sector Equities: Flows Diverge from Performance
Sector flows painted a picture of selective buying.
Industrials and consumer staples led with more than half a billion dollars each in inflows, joined by materials at $476 million.
Yet the week’s star performers, energy and materials, up 4.1% and 3.3% respectively, did not draw proportionate new money.
Information technology was the biggest drag, bleeding nearly $4.8 billion, despite eking out a small gain of 0.1%.
Financials and communication services also saw heavy redemptions, each losing over $1 billion, alongside negative returns.
Global Rotation: US Outflows, Emerging Markets Inflows
Investors pulled an eye-catching $12.6 billion from US equity ETFs, setting the tone for developed market outflows overall.
By contrast, flows favored global funds with $2 billion of inflows, and emerging markets, particularly China and Mexico, which together added over $600 million.
On the performance side, Saudi Arabia and Argentina were standouts, up 5.4% and 4.8% respectively, while Asian markets like the Philippines and India lagged sharply.
Thematics: AI Still Hot, Crypto Still Cold
Artificial intelligence and big data themes continued to capture imagination, taking in more than $800 million, the strongest inflow across thematic ETFs. Global defense and disruptive tech also drew solid interest.
Meanwhile, cryptocurrency-themed ETFs lost $719 million, and multiple-trend funds saw redemptions as well.
The performance leaderboard told a different story: strategic metals surged 6.9% and battery value-chain funds gained over 5%, while cannabis and psychedelic strategies tumbled more than 7%.
Fixed Income: Broad Strength Across the Board
Bond ETFs remained the clear safe haven, with corporate investment grade funds drawing $2.7 billion, aggregate bond strategies adding $3.6 billion across different flavors, and government investment grade capturing another $2.2 billion. Municipal bonds were the lone loser, with redemptions of $373 million.
Commodities: Precious Metals Power Ahead
Precious metals ETFs dominated both flows and returns. Gold drew nearly $2 billion, silver funds nearly $271 million, while platinum and palladium led performance with gains of 8.2% and 7.2% respectively. Oil also rallied, with crude-focused ETFs climbing 5.2%.
Crypto ETFs: Mixed Signals Amid Outflows
Despite broad outflows from crypto ETFs, led by ether with $488 million in redemptions and bitcoin with $248 million, smaller tokens attracted selective buying.
Solana and XRP drew $88 million and $61 million, while Dogecoin managed modest inflows.
Still, performance across crypto strategies was negative, with crypto funds down nearly 6% on the week.
Top Movers and Favorites
Among individual ETFs, commodity-linked products dominated performance. The GraniteShares Platinum Trust surged 11.4%, while silver and lithium miners ETFs gained between 9 and 10%.
On the flow front, large-cap US equity trackers remained unrivaled in popularity.
The iShares Core S&P 500 ETF alone took in nearly $39 billion, dwarfing all others.
SPDR’s flagship S&P 500 ETF added $11.3 billion, while small caps via the iShares Russell 2000 ETF drew just over $2 billion.
Gold, corporate bonds, and international equity funds also featured prominently among the week’s most popular vehicles.
Issuers: The iShares Tsunami
No issuer came close to matching BlackRock’s iShares, which pulled in nearly $38 billion. SPDR followed with $4.9 billion and Invesco added $3.1 billion. On the losing side, Vanguard stood out with a staggering $41 billion in outflows, while Schwab and VanEck also saw significant redemptions.
What Happened in European and Canadian ETF Markets?
Our partners at Trackinsight have the full recap here.
Please note this article is for information purposes only and does not in any way constitute investment advice. It is essential that you seek advice from a registered financial professional prior to making any investment decision.
Segments
See all
No specific market segments were tagged
Mentioned ETFs
No specific ETFs were tagged
Further reading
Latest ETF News
See all ETF news


The Weekly ETF Market Monitor (June 22-26, 2026)


 Advantages of ETFs over Mutual Funds1/6
Lower Costs
In this guide, we'll explore the advantages of ETFs over mutual funds, giving you valuable insights into why ETFs have gained significant popularity among investors like yourself.
Leveraged ETFs: Unlocking the Potential for Amplified Returns1/6
Understanding Leveraged ETFs
Explore leveraged ETFs: potential for amplified returns & risks. 5 ETFs to consider across equities, commodities & fixed income.
What is a Leveraged ETF?1/6
Introducing Leveraged and Inverse ETFs
In this guide, we'll dive into the world of leveraged ETFs, exploring their definition, mechanics, potential risks, and rewards.
Recent educational content

ETF Trends
ETF Industry KPIs July 13, 2026
This week’s KPI data overview highlights key metrics and trends shaping the ETF landscape.


First Look ETF
First Look ETF: Cash Deployment, Bond, and Hedged ETFs
In this season 6 episode of First Look ETF, Stephanie Stanton examines the latest ETF marketplace trends with NYSE and guests.

ETF Trends
ETF Industry KPIs July 6, 2026
This week’s KPI data overview highlights key metrics and trends shaping the ETF landscape.

Asset TV
The ETF Show - The Evolution of Leveraged & Inverse ETFs
Leveraged and inverse ETFs have exploded in popularity over the past decade capturing more assets as retail traders seek to capture volatility.

Browse all educational columns



Build and Analyze Your ETF Portfolio Like a Pro
Create your own ETF portfolio in minutes and instantly see allocations, exposures, performance, and risk. Visualize diversification across asset classes, regions, and sectors. Stress-test ideas, compare benchmarks, and refine your strategy with professional-grade analytics.
