Explore professionally built ETF model portfolios. Discover now →



ETF Insights: Top 5 Fund Flows and Segments for April 2023
A brief look at the ETF segments and solutions that received the most net fund flows in April 2023.

Keep up with what matters in ETFs
Get timely ETF insights, market trends, and top ideas straight to your inbox.
Your newsletter subscriptions with us are subject to ETF Central's Privacy Policy and Terms and Conditions.
Despite there being a sentiment of uncertainty regarding the strength of the US economy, recent economic indicators have pointed to modest growth in spending and production. For April 2023, ETF Central’s segments with the greatest net fund flows were US Government Bonds ($6.30 bn), US Aggregate Bonds ($4.03 bn), US Multi-Factor ($3.74 bn), Structured Products ($ 3.74 bn), and US Corporate Investment Grade Bond ($3.37 bn).
Like what you're reading?
Stay in the loop — get the latest ETF insights: trends, analysis, and expert picks.
A look at each Segment and ETF Flows
US Government Bonds

Continuing the trend seen in March 2023, the US Government Bond segment took in the greatest flows for the month of April 2023. As observed from the data, intermediate and long-dated treasuries that offered higher interest rates were the preferred choice among investors. Among asset managers, BlackRock’s iShares offerings held three of the top five category leading ETFs, with the iShares 20+ Year Treasury Bond ETF (TLT) being the leading recipient of fund flows, while exhibiting the best performance of the group.
US Aggregate Bond

Within the US Aggregate Bond segment, the Vanguard Total Bond Market ETF (BND) garnered the most flows for the month. Given the high degree of uncertainty still present in the economy, US Aggregate bond solutions provide investors with broad exposure to the investment grade segments of the US Fixed Income market. Though BND received the most flows, the Vanguard Long-Term Bond (BLV) had the best performance of the group.
US Multi-Factor

The US Multi-Factor segment saw the third most flows for the month, building on the strong performance exhibited from the month prior. The US Multi-Factor segment continues to be a safe haven for investors, given the diverse offering of investment strategies that investors can utilize within their portfolio. Though all top 5 ETFs exhibited strong performance for the month, the Invesco Russell 1000 Dynamic Multifactor ETF (OMFL) had the highest return, while the iShares Edge MSCI USA Quality Factor ETF (QUAL) garnered the highest flows. As uncertainty about the US economy remains, it is possible that flows into this category will continue to grow, as investors will feel most comfortable utilizing strategies that have a clear value proposition and have proven their ability to perform through different stages of the economic cycle.
Structured Products

Given the current market uncertainty, it is quite understandable why investors are taking a greater interest in structured product offerings. The JP Morgan Equity Premium ETF (JEPI) garnered the majority of fund flows in this segment for the month, as it has become a top-of-mind solution for market risk mitigation by many investors. The innovator S&P 500 Power Buffer ETF – April (PAPR) had the second largest fund flows for the month; as buffer ETFs have become a popular offering among ETF providers. From a performance perspective, the JP Morgan Nasdaq Equity Premium Income ETF (JEPQ) performed the best among the top 5 ETFs in focus.
US Corporate Investment Grade Bonds

The US Corporate Investment Grade Bond segment received the fifth most flows for the month. Within the grouping, the Schwab 5-10 Year Corporate Bond ETF (SCHI) received the most flows, however the top performing solution was the Vanguard Long-Term Corporate Bond ETF (VCLT). With the current interest rate environment being ‘higher for longer’, the appeal of US corporate investment grade bonds has increased, as investors are seeking investment solutions that can be a source of income generation for their portfolio.
Please note this article is for information purposes only and does not in any way constitute investment advice. It is essential that you seek advice from a registered financial professional prior to making any investment decision.
Segments
See all
Mentioned ETFs
Further reading

Latest ETF News
See all ETF newsMoneyShow Chart of the Day 9/4/26: Don't Just Watch Oil. Watch THESE.


Chart of the Day 8/14/26: The Great "Hot Money" Migration

MoneyShow Chart of the Day 7/29/26: Now, THAT's What I Call Market Rotation!

MoneyShow Chart of the Day 7/16/26: Good News/Bad News on Inflation (and the Fed)




 Advantages of ETFs over Mutual Funds1/6
Lower Costs
In this guide, we'll explore the advantages of ETFs over mutual funds, giving you valuable insights into why ETFs have gained significant popularity among investors like yourself.
Leveraged ETFs: Unlocking the Potential for Amplified Returns1/6
Understanding Leveraged ETFs
Explore leveraged ETFs: potential for amplified returns & risks. 5 ETFs to consider across equities, commodities & fixed income.
What is a Leveraged ETF?1/6
Introducing Leveraged and Inverse ETFs
In this guide, we'll dive into the world of leveraged ETFs, exploring their definition, mechanics, potential risks, and rewards.
Recent educational content

ETF Trends
ETF Industry KPIs September 8, 2026
This week’s KPI data overview highlights key metrics and trends shaping the ETF landscape.

ETF Trends
ETF Industry KPIs August 31, 2026
This week’s KPI data overview highlights key metrics and trends shaping the ETF landscape.
ETF Trends
ETF Industry KPIs August 24, 2026
This week’s KPI data overview highlights key metrics and trends shaping the ETF landscape.
What’sTheFund
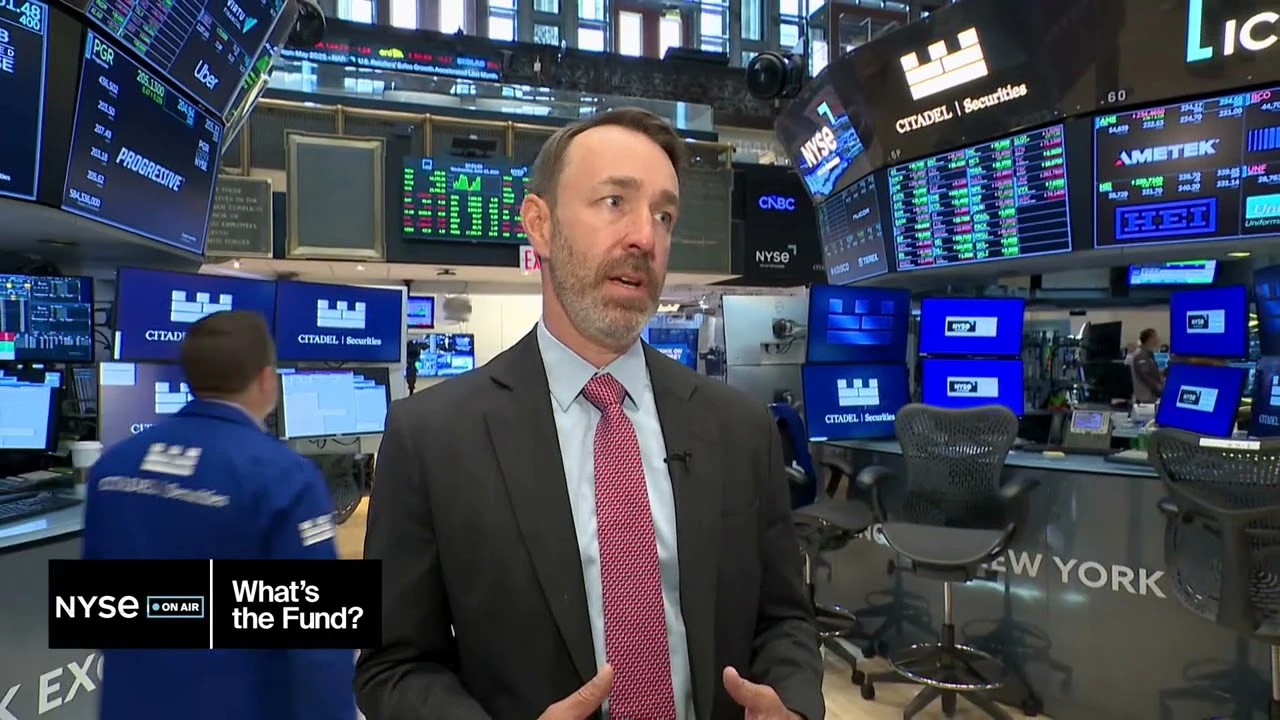
What's the Fund | Ocean Park Diversified Income ETF (DUKZ)
James St Aubin, Chief Investment Officer at Ocean Park Asset Management, discuss the DUKZ ETF, exposing investors to the whole spectrum of asset classes in the fixed income markets, through their rules-based process.

Browse all educational columns



Build and Analyze Your ETF Portfolio Like a Pro
Create your own ETF portfolio in minutes and instantly see allocations, exposures, performance, and risk. Visualize diversification across asset classes, regions, and sectors. Stress-test ideas, compare benchmarks, and refine your strategy with professional-grade analytics.
