Keep tabs on your favorite ETFs with a personalized weekly tracker. Create a Watchlist now →



ETF Comparison: Vanguard Total World Stock ETF (VT) Versus Dimensional World Equity ETF (DFAW)
Vanguard's passive VT meets Dimensional's factor-tilted DFAW in a head-to-head on cost, methodology and risk.

Keep up with what matters in ETFs
Get timely ETF insights, market trends, and top ideas straight to your inbox.
Your newsletter subscriptions with us are subject to ETF Central's Privacy Policy and Terms and Conditions.
Most investors and advisors would probably agree that a global equity allocation is a sensible component of a long-term investment portfolio. How you get that exposure through ETFs, however, has become a more interesting question.
You can certainly opt for a low-cost, passive, market-cap-weighted index ETF. But there's also a growing selection of actively managed alternatives, and the fees on these strategies have come down considerably compared with the active mutual funds of the past.
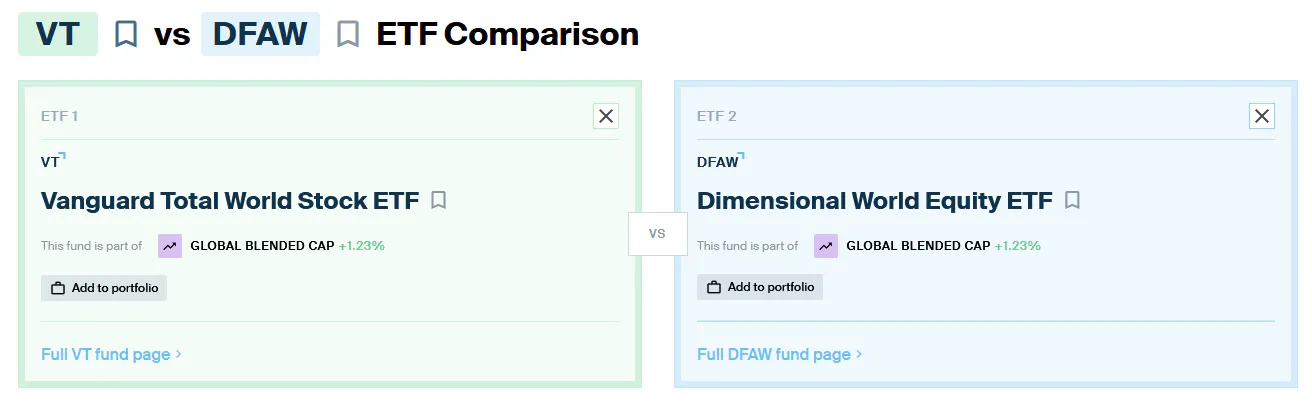
So today, we're pitting two different approaches against each other: passive management through the Vanguard Total World Stock ETF (VT) versus active management through the Dimensional World Equity ETF (DFAW). We'll see what the ETF Central Comparison Tool says across our usual three categories: total cost of ownership, methodology and exposure, and risk and return.
Get data on 14,000+ ETFs
Access Trackinsight's reliable and comprehensive data with 500M+ points on 14,000+ ETFs.
Total Cost of Ownership
This category is a fairly broad sweep for VT. VT charges a 0.06% expense ratio compared with 0.24% for DFAW, making DFAW four times as expensive. On a $10,000 investment, that's roughly $6 versus $24 in annual fund expenses, assuming the investment value remains constant.
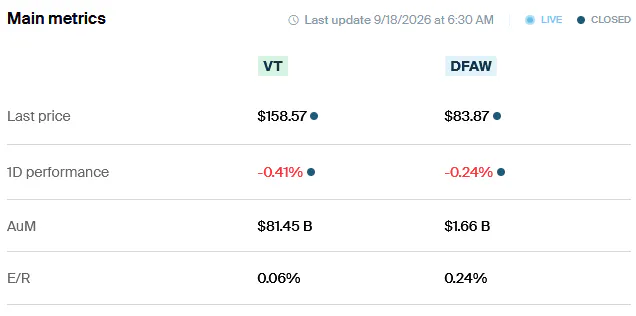
That said, I wouldn't characterize DFAW as expensive on its own. A 0.24% expense ratio is quite reasonable for an actively managed global equity strategy, particularly compared with many legacy active mutual funds and even some actively managed factor ETFs.
Fund expenses aren't the only cost to consider, though. Trading liquidity matters as well, and VT's enormous asset base and trading volume give it another advantage. Its 30-day average bid-ask spread is around 0.02%, compared with 0.073% for DFAW.
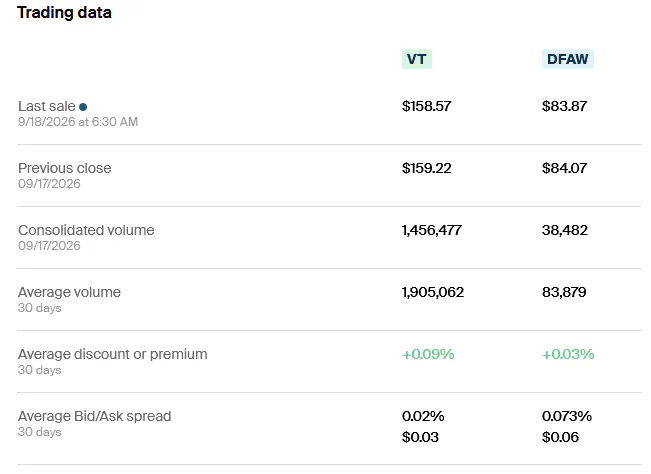
Verdict: DFAW's spread is more than three times as wide, although 0.073% is hardly excessive for most long-term investors. Still, VT wins on both recurring expenses and trading costs.
Methodology and Exposure
This is where the comparison gets more interesting. Despite substantial overlap in their holdings and broadly similar historical returns, these ETFs arrive at their global equity exposure in very different ways.
VT is the simpler of the two. It passively tracks the FTSE Global All Cap Index, providing exposure to more than 9,700 large-, mid- and small-cap stocks across the U.S., international developed markets and emerging markets. Companies are weighted primarily according to their market capitalization.
DFAW takes a more active approach using a fund-of-funds structure. Rather than directly owning its entire global portfolio like VT, DFAW allocates among other Dimensional strategies covering U.S., international developed and emerging-market equities, along with real estate.
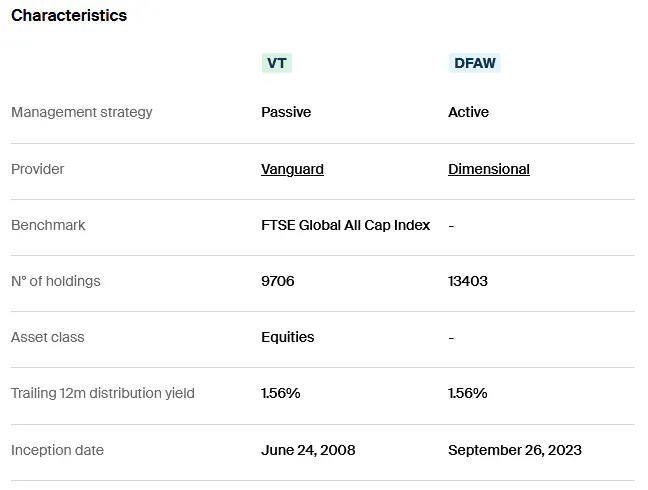
The result is similarly broad diversification across thousands of stocks, but Dimensional isn't simply accepting market capitalization as the final word on portfolio construction. Its approach emphasizes characteristics including smaller market capitalizations, lower relative prices and higher profitability.
If those characteristics sound familiar, there's a reason. Size, value and profitability are closely associated with the academic factor research of Eugene Fama and Kenneth French, and Dimensional has spent decades implementing similar concepts in investable portfolios.
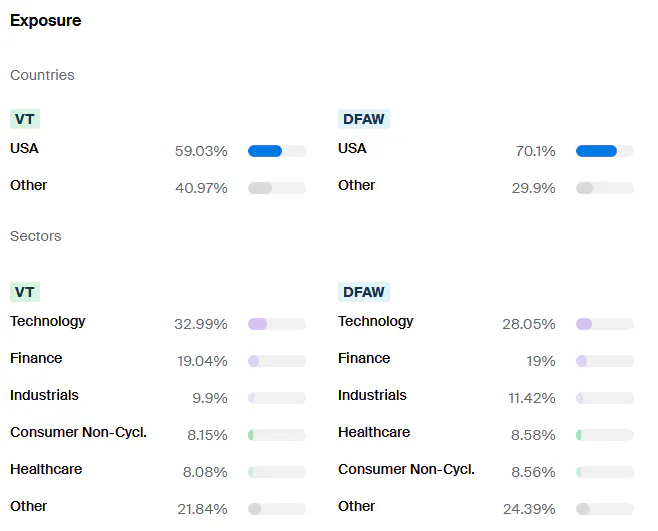
That produces some meaningful differences in exposure. DFAW currently carries roughly 10 percentage points more U.S. equity exposure than VT, while holding less technology exposure.
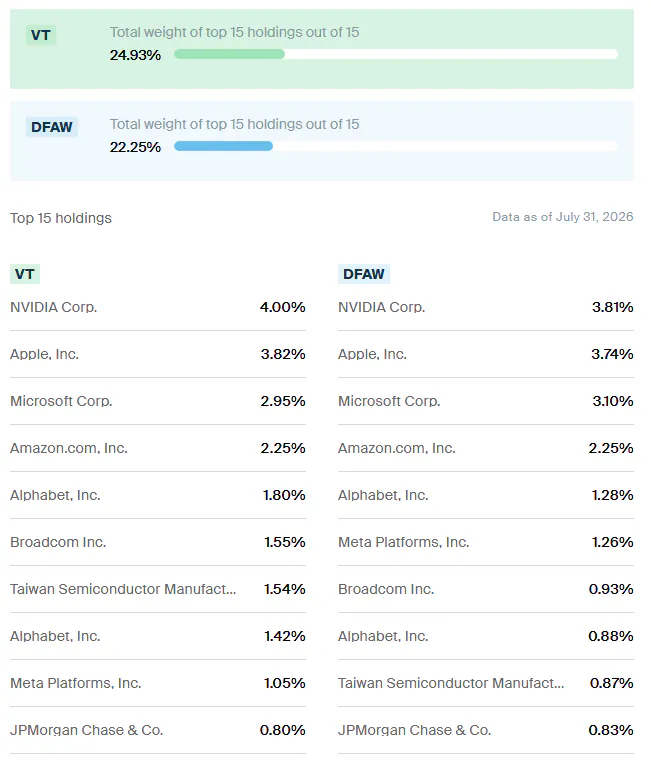
DFAW is also slightly less top-heavy. Its 15 largest holdings represent a somewhat smaller share of assets, with differences particularly apparent among the Magnificent Seven stocks.
Verdict: I prefer DFAW's methodology here. There's nothing inherently wrong with market-cap weighting, and VT implements it exceptionally efficiently. But tilting a globally diversified portfolio toward value, profitability and smaller companies strikes me as a sensible way to depart from pure market-cap exposure without turning the portfolio into a concentrated active bet.
Risk and Return
DFAW doesn't have nearly as much history as VT, so this comparison necessarily focuses on a relatively short common period. Over the trailing one-year and year-to-date periods, returns have been broadly similar. Both ETFs have also attracted net inflows, although VT's flows remain considerably larger given its scale and longer-established investor base.
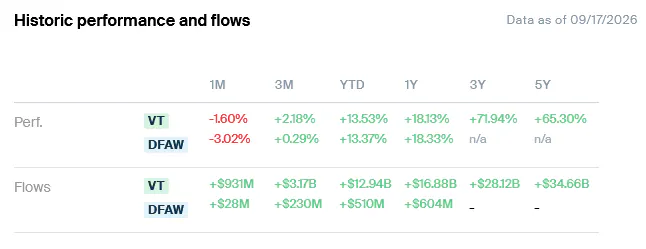
The risk statistics are similarly close. DFAW has exhibited slightly lower volatility over the available common period and experienced a somewhat smaller maximum drawdown. Neither difference has been large enough to suggest these are fundamentally different risk profiles. Both remain broadly diversified, essentially fully invested global equity portfolios.
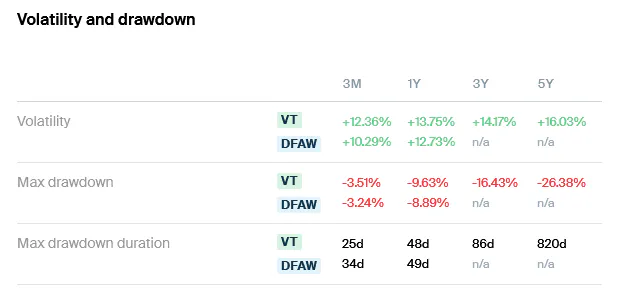
Verdict: On returns alone, there's little separating them. But at this point in the market cycle, I particularly like the potential diversification benefit from DFAW's value, profitability and size tilts. Its 0.24% expense ratio also keeps the hurdle for active management relatively low. Given the broadly comparable returns so far, slightly better observed risk characteristics and relatively inexpensive implementation of those factor tilts, I'd give DFAW the edge here.
Please note that this article reflects the author’s personal views and does not represent the opinions of the publication or its affiliates. It is for informational purposes only and does not constitute investment advice. It is essential to seek guidance from a registered financial professional before making any investment decisions.
Latest ETF News
See all ETF newsETF Comparison: NEOS Russell 2000 High Income ETF (IWMI) Versus Global X Russell 2000 Covered Call ETF (RYLD)
ETF Comparison: NEOS Nasdaq-100 High Income ETF (QQQI) Versus Goldman Sachs Nasdaq-100 Premium Income ETF (GPIQ)



 Advantages of ETFs over Mutual Funds1/6
Lower Costs
In this guide, we'll explore the advantages of ETFs over mutual funds, giving you valuable insights into why ETFs have gained significant popularity among investors like yourself.
Leveraged ETFs: Unlocking the Potential for Amplified Returns1/6
Understanding Leveraged ETFs
Explore leveraged ETFs: potential for amplified returns & risks. 5 ETFs to consider across equities, commodities & fixed income.
What is a Leveraged ETF?1/6
Introducing Leveraged and Inverse ETFs
In this guide, we'll dive into the world of leveraged ETFs, exploring their definition, mechanics, potential risks, and rewards.
Recent educational content

ETF Trends
ETF Industry KPIs October 5, 2026
This week’s KPI data overview highlights key metrics and trends shaping the ETF landscape.

ETF Trends
ETF Industry KPIs September 28, 2026
This week’s KPI data overview highlights key metrics and trends shaping the ETF landscape.
ETF Trends
ETF Industry KPIs September 22, 2026
This week’s KPI data overview highlights key metrics and trends shaping the ETF landscape.
First Look ETF
First Look ETF: Income, Corporate Arbitrage, and Growth and Value Investing
First Look ETF September 2026: iCapital, Mast Investments and North Square unpack new ETFs targeting monthly income, merger arbitrage and complementary growth and value exposure.

Browse all educational columns



Expert-Built ETF Portfolios, All in One Place
Don’t start from scratch. Discover ready-made ETF portfolios built by professionals to match different goals, timelines, and market views. Use them as inspiration or as a starting point for your own allocation.