ETF model portfolios designed for real investor needs. Discover →



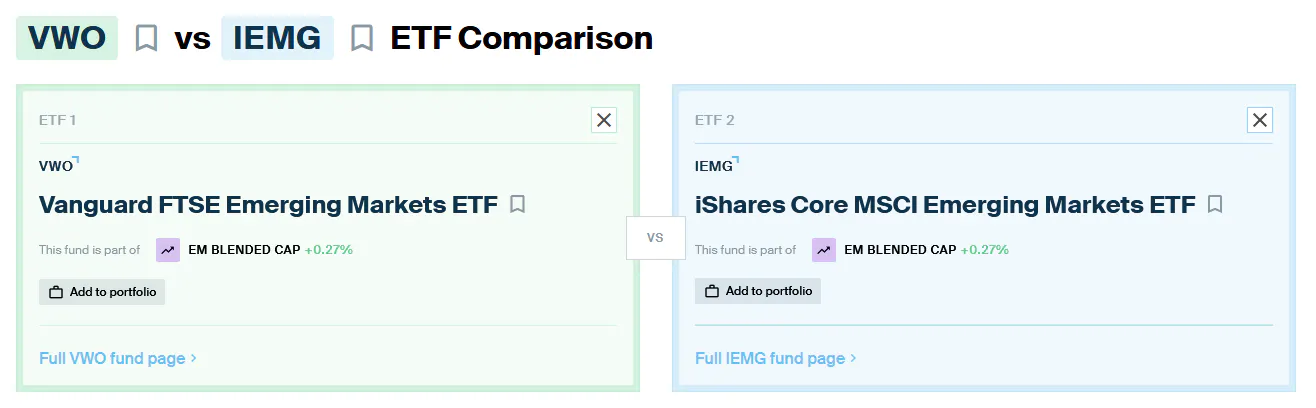
ETF Comparison: Vanguard FTSE Emerging Markets ETF (VWO) Versus iShares Core MSCI Emerging Markets ETF (IEMG)
Two of the largest emerging market ETFs go head-to-head in this week’s ETF comparison.

Keep up with what matters in ETFs
Get timely ETF insights, market trends, and top ideas straight to your inbox.
Your newsletter subscriptions with us are subject to ETF Central's Privacy Policy and Terms and Conditions.
Emerging markets are catching investors’ attention again. Year-to-date, emerging market equities are outperforming U.S. stocks, continuing the momentum we already saw throughout 2025. And there is nothing that gets investors to reassess their portfolio allocations faster than recency bias.
Still, how you choose to access emerging markets matters. Broadly speaking, there are two ways investors tend to approach the space.
The first is drilling down into individual countries you specifically want to overweight. There is no shortage of country-specific ETFs targeting places like China, India, Brazil, or Korea. The second approach is simply going broad across emerging economies and letting a market-cap weighted benchmark determine allocations for you.
For that latter approach, two ETFs have emerged as the dominant options by AUM: the Vanguard FTSE Emerging Markets ETF
Both occupy essentially the same niche. They provide low-cost, market-cap weighted exposure to hundreds, if not thousands, of emerging market companies across multiple countries and sectors.
But despite appearing very similar at first glance, the differences in their underlying benchmark methodologies lead to some noticeable differences in country exposure, holdings composition, and ultimately performance.
So today, using data from ETF Central’s comparison tool, we’re going to break down how VWO and IEMG stack up, which one may be the better choice for broad emerging market exposure.
Global ETF Survey 2026 is Live!
With 1,790 new products launched by July 2026, choosing is harder than ever. Our Global ETF Survey 2026, built on 620 professional investors and allocators, shows how active, fixed income, options-based and thematic ETFs are reshaping fund selection.
VWO vs. IEMG: Total Cost of Ownership
Both of these ETFs are intended to serve as low-cost beta exposure to emerging markets, and both accomplish that with expense ratios under 10 basis points.
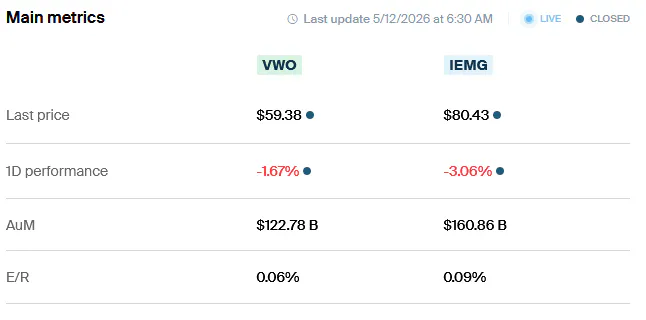
Still, in classic Vanguard fashion, VWO comes in slightly cheaper at a 0.06% expense ratio versus 0.09% for IEMG. Assuming a $10,000 investment, that translates into roughly $6 annually in direct fee drag for VWO versus about $9 for IEMG.
Of course, expense ratios are not the only cost ETF investors incur. If you are actively buying and selling ETFs, another important source of drag comes from the bid-ask spread, which is the gap between the highest current buyer and lowest current seller.
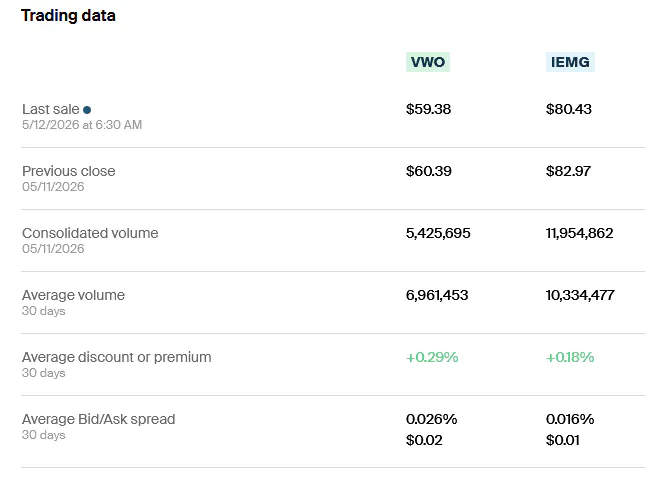
Here, IEMG actually has a slight edge. Over a 30-day average, IEMG posted a bid-ask spread of 0.016%, while VWO was modestly wider at 0.026%.
Verdict: Even after accounting for VWO’s slightly wider spread, the combined total cost of ownership still comes out lower overall than IEMG. Now, to be clear, both ETFs are extremely affordable by industry standards. We are absolutely splitting hairs here. But if we are comparing purely on cost, VWO is the slightly cheaper option overall.
VWO vs. IEMG: Methodology and Exposure
Both VWO and IEMG are passive index-tracking ETFs. There is no active management involved here. Each fund is simply attempting to replicate the performance of its underlying benchmark. The difference is that the benchmark providers themselves use different classification systems and methodologies.
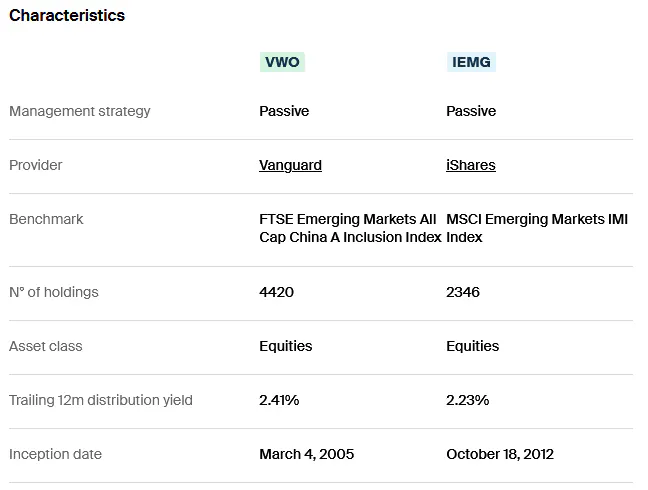
Starting with VWO, this ETF tracks the FTSE Emerging Markets All Cap China A Inclusion Index. The portfolio spans more than 4,400 stocks and currently carries a trailing 12-month yield of 2.41%. For those unfamiliar, “China A Inclusion” refers to mainland Chinese A-shares listed directly on domestic Chinese exchanges, rather than only offshore H-shares or U.S.-listed ADRs. In other words, VWO is trying to capture a broader slice of the Chinese equity market.
IEMG, meanwhile, tracks the MSCI Emerging Markets IMI Index. IMI stands for Investable Market Index, meaning the benchmark also includes large-, mid-, and small-cap stocks. The portfolio is somewhat narrower at roughly 2,300 holdings, though still extremely diversified in practice, and currently pays a trailing 12-month yield of 2.23%.
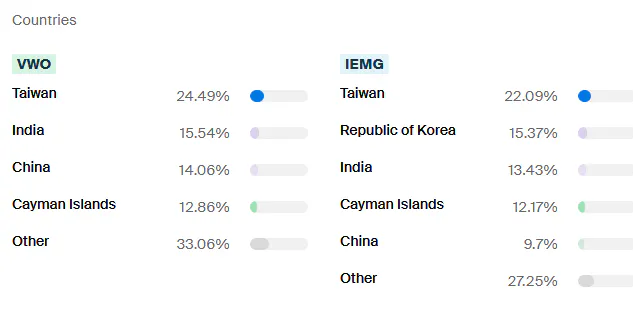
The biggest difference between the two ETFs is country exposure. Both ETFs heavily overweight Taiwan, India, and China. However, IEMG also includes roughly a 15% allocation to South Korea, which VWO completely lacks. This comes down entirely to index classification differences. FTSE classifies South Korea as a developed market, while MSCI still treats it as emerging.
Now, whether South Korea is “developed” or “emerging” is honestly a somewhat semantic debate at this point. China has one of the largest economies on Earth and is still classified as emerging in many benchmarks. The important takeaway for investors is simply this: depending on which ETF you choose, you either get meaningful exposure to Korean equities or none at all.
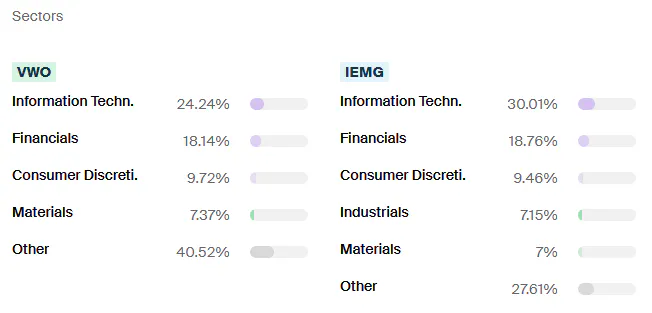
That distinction also shows up in sector composition. IEMG’s technology exposure sits around 30% of the portfolio, noticeably above VWO’s roughly 24%. After that, though, the allocations look fairly similar, with both ETFs heavily weighted toward financials followed by consumer discretionary.
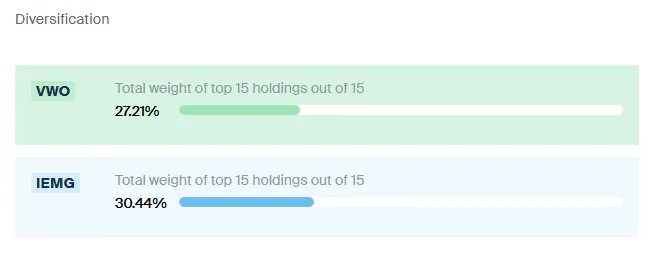
Neither ETF is especially concentrated despite their market-cap weighted structures. VWO’s top 15 holdings account for roughly 27.21% of assets, while IEMG’s top 15 holdings are slightly more concentrated at 30.44%.
At the individual holding level, there is substantial overlap. Both ETFs prominently feature names like Taiwan Semiconductor Manufacturing Company, Tencent Holdings, and Alibaba Group. But again, IEMG includes two major Korean holdings absent from VWO: Samsung Electronics and SK Hynix, both of which have benefited significantly from the recent artificial intelligence infrastructure and memory buildout.
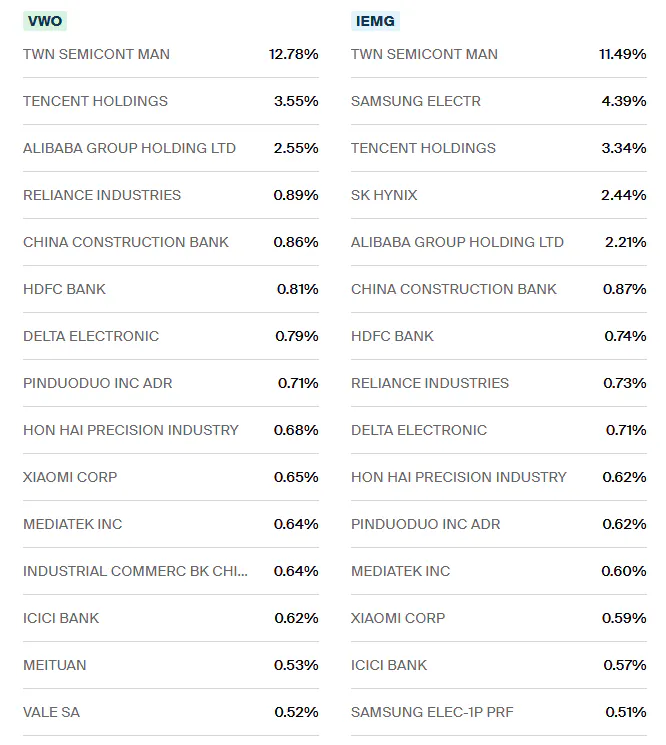
Verdict: I prefer IEMG here. My reasoning mostly comes down to South Korea exposure. I view Korea as economically tied enough to the broader emerging market ecosystem that I want it included in my allocation. And given the strength of Korean semiconductor and technology companies recently, I think excluding them entirely leaves a pretty meaningful hole in an emerging markets portfolio
VWO vs. IEMG: Risk and Return
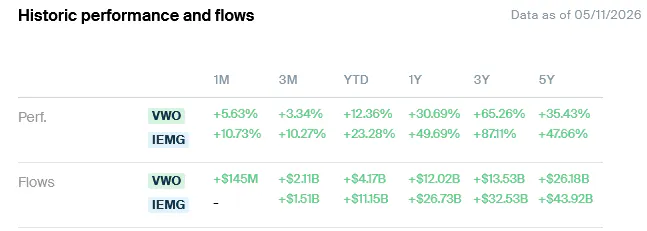
Over the trailing year-to-date, one-year, three-year, and five-year periods, IEMG has noticeably outperformed VWO. The primary driver behind that outperformance has been IEMG’s South Korean exposure, particularly its allocations to SK Hynix and Samsung Electronics.
Both companies have benefited heavily from the artificial intelligence infrastructure buildout, especially surging demand for DRAM and NAND flash memory used in AI servers, hyperscale data centers, and advanced semiconductor applications.
High-bandwidth memory in particular has become a critical bottleneck within the AI supply chain, and Korean memory manufacturers have been some of the largest beneficiaries. VWO lacks that exposure.
Instead, most of VWO’s semiconductor allocation comes through Taiwanese equities, particularly Taiwan Semiconductor Manufacturing Company. While TSMC has also performed very well, VWO misses out on the additional tailwind from Korean memory and storage companies.
Fund flows have reflected that performance gap as well. Not only has IEMG grown larger than VWO in assets under management, but it has also attracted substantially stronger net inflows across the year-to-date, one-year, three-year, and five-year periods.
Now, in terms of risk, both ETFs are volatile. Emerging markets are generally considered riskier than developed equities for a variety of reasons, including political instability, currency fluctuations, weaker regulatory frameworks, capital controls, and greater sensitivity to global trade and commodity cycles.
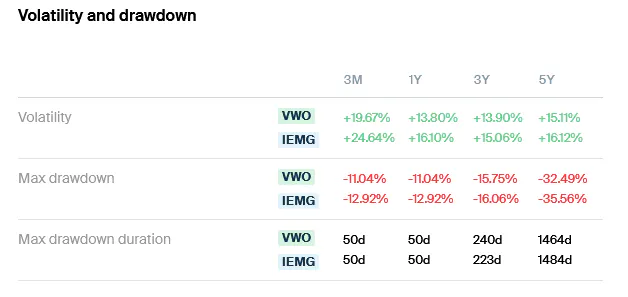
Looking at annualized volatility across the one-, three-, and five-year periods, both ETFs screen as fairly high volatility products, although IEMG consistently comes in slightly higher. Again, that heavier technology weighting is somewhat of a double-edged sword. It has boosted returns, but it also increases portfolio sensitivity to sentiment swings in semiconductors and growth stocks.
That cyclicality also shows up in drawdowns. Over longer three- and five-year periods, IEMG experienced somewhat deeper peak-to-trough declines and longer recovery periods than VWO. Technology rallies tend to be sharp, but tech selloffs can also be brutal when momentum reverses.
Verdict: I continue to prefer IEMG. Yes, you are accepting somewhat higher volatility in exchange for that additional Korean technology exposure. But in my view, the inclusion makes IEMG feel more representative of the actual emerging market opportunity set today, especially given how important semiconductors, memory, and electronics manufacturing have become within the global economy.
Please note this article is for information purposes only and does not in any way constitute investment advice. It is essential that you seek advice from a registered financial professional prior to making any investment decision.

Latest ETF News
See all ETF newsThere's an ETF for That? Humanoid Robotics and Physical AI

How Some ETF Issuers Use Their Own Funds for Cash Management

These Public-Private ETFs Invest in Polymarket and Anduril

There's an ETF for That? Frontier Markets




 Advantages of ETFs over Mutual Funds1/6
Lower Costs
In this guide, we'll explore the advantages of ETFs over mutual funds, giving you valuable insights into why ETFs have gained significant popularity among investors like yourself.
Leveraged ETFs: Unlocking the Potential for Amplified Returns1/6
Understanding Leveraged ETFs
Explore leveraged ETFs: potential for amplified returns & risks. 5 ETFs to consider across equities, commodities & fixed income.
What is a Leveraged ETF?1/6
Introducing Leveraged and Inverse ETFs
In this guide, we'll dive into the world of leveraged ETFs, exploring their definition, mechanics, potential risks, and rewards.
Recent educational content

ETF Trends
ETF Industry KPIs October 5, 2026
This week’s KPI data overview highlights key metrics and trends shaping the ETF landscape.

ETF Trends
ETF Industry KPIs September 28, 2026
This week’s KPI data overview highlights key metrics and trends shaping the ETF landscape.
ETF Trends
ETF Industry KPIs September 22, 2026
This week’s KPI data overview highlights key metrics and trends shaping the ETF landscape.
First Look ETF
First Look ETF: Income, Corporate Arbitrage, and Growth and Value Investing
First Look ETF September 2026: iCapital, Mast Investments and North Square unpack new ETFs targeting monthly income, merger arbitrage and complementary growth and value exposure.

Browse all educational columns



Expert-Built ETF Portfolios, All in One Place
Don’t start from scratch. Discover ready-made ETF portfolios built by professionals to match different goals, timelines, and market views. Use them as inspiration or as a starting point for your own allocation.