Open Now: The Global ETF Survey Take the Survey →

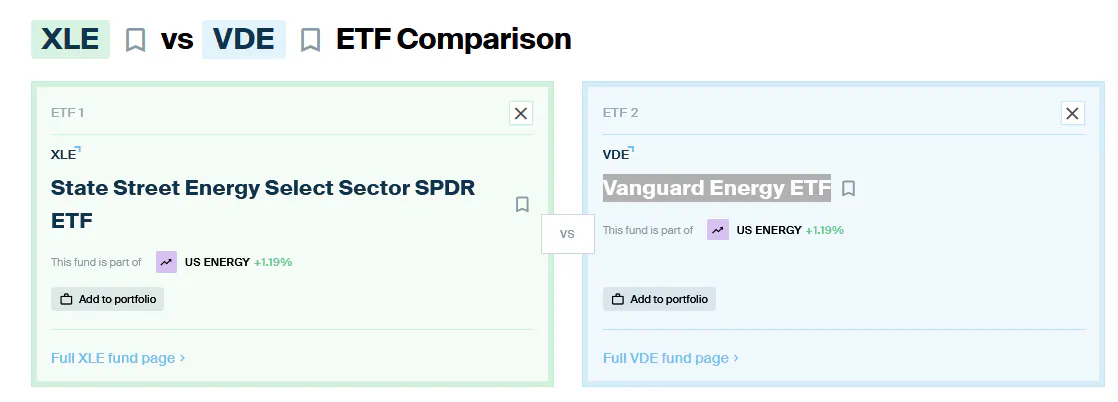
ETF Comparison: State Street Energy Select Sector SPDR ETF (XLE) Versus Vanguard Energy ETF (VDE)
The U.S. energy sector is heavily outperforming year-to-date. Here’s how the two most popular sector ETFs by AUM fare head-to-head.

Keep up with what matters in ETFs
Get timely ETF insights, market trends, and top ideas straight to your inbox.
Your newsletter subscriptions with us are subject to ETF Central's Privacy Policy and Terms and Conditions.
As I’m writing this, the U.S. and U.S.-backed conflict with Iran has entered its 20th day, and the Strait of Hormuz remains effectively closed to Western shipping.
Gas prices are climbing across the country, but for energy investors, there has been a clear upside. Year-to-date according to FinViz, the energy sector is up about 30.5%. For context, the next best-performing sectors, utilities and materials, are only up around 9% over the same period.
That divergence has sparked renewed interest in energy ETFs, with investors rotating back into sectors that tend to benefit from supply shocks and geopolitical instability. In particular, two funds have attracted the bulk of inflows: the Energy Select Sector ETF (XLE) and the Vanguard Energy ETF (VDE).
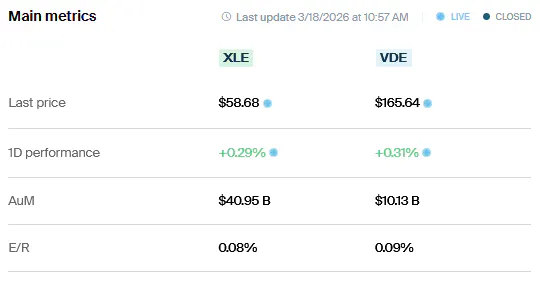
The interest is not surprising given their scale. XLE currently manages about $40.95 billion in assets, while VDE holds roughly $10.13 billion. That makes them the first- and third-largest energy ETFs in the U.S. market.
But while both provide exposure to the same sector, their construction and exposures differ in meaningful ways. Here’s how they stack up using data from ETF Central’s comparison tool.
The ETF Industry Is Evolving Fast
From AI infrastructure to active strategies, the ETF landscape is shifting. Share your perspective in the 7th Annual Global ETF Survey and get exclusive early access to the final report.
XLE vs. VDE: Total Cost of Ownership
Both ETF providers have rolled out broad fee cuts across their lineups, but State Street has a slight edge here. Its Select Sector ETFs, including XLE, now carry a 0.08% expense ratio, down from 0.10%. VDE is just a touch more expensive at 0.09%.
That said, the expense ratio is only one part of the equation. Trading costs matter too. The bid-ask spread, which is the difference between the price you buy and sell at, can add up, especially for more active traders. Here again, XLE comes out ahead. As of writing, XLE has a 30-day average bid-ask spread of 0.019%. VDE is still quite efficient, but slightly wider at 0.027%.
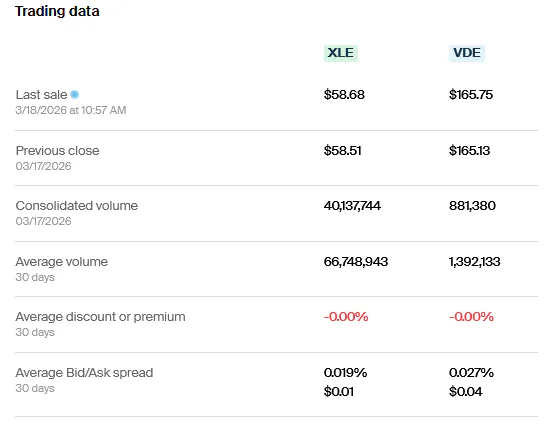
Verdict: When you combine the expense ratio with the bid-ask spread, XLE is the more cost-effective option. The difference is small, and for long-term investors it likely won’t matter much, but on an objective basis, XLE takes the edge.
XLE vs. VDE: Methodology and Exposure
Both ETFs are passive index trackers, but they follow very different benchmarks, and that leads to meaningful differences in how each portfolio is built, even with a fair amount of overlap.
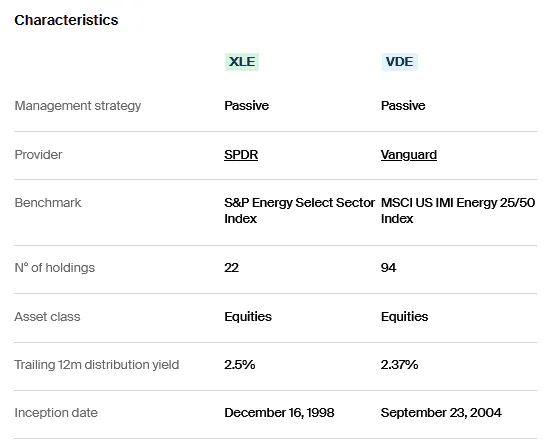
Starting with XLE, this ETF tracks the S&P Energy Select Sector Index, which consists of just 22 energy stocks pulled from the S&P 500. That constraint matters. It effectively limits the portfolio to large-cap companies that have already met strict size, liquidity, and profitability requirements. From there, the holdings are market-cap weighted, which naturally concentrates the portfolio in the biggest names.
VDE takes a broader approach. It tracks the MSCI US IMI Energy 25/50 Index. IMI stands for Investable Market Index, and in this case, it expands the universe to 94 holdings across large-, mid-, and small-cap energy companies. Despite that broader reach, it is still market-cap weighted, so the top holdings will look familiar.
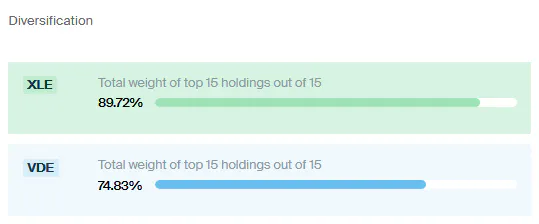
That difference in breadth shows up clearly in concentration. The top 15 holdings in XLE account for 89.72% of the portfolio. VDE is less concentrated at 74.83%, reflecting its wider opportunity set.
Looking at the holdings, both ETFs are dominated by Exxon Mobil and Chevron, the integrated supermajors. However, XLE allocates slightly more to each, reinforcing its top-heavy structure. Beyond that, both funds include names like ConocoPhillips, Williams, Schlumberger, EOG Resources, Kinder Morgan, and Phillips 66, giving exposure across upstream, midstream, and downstream segments.
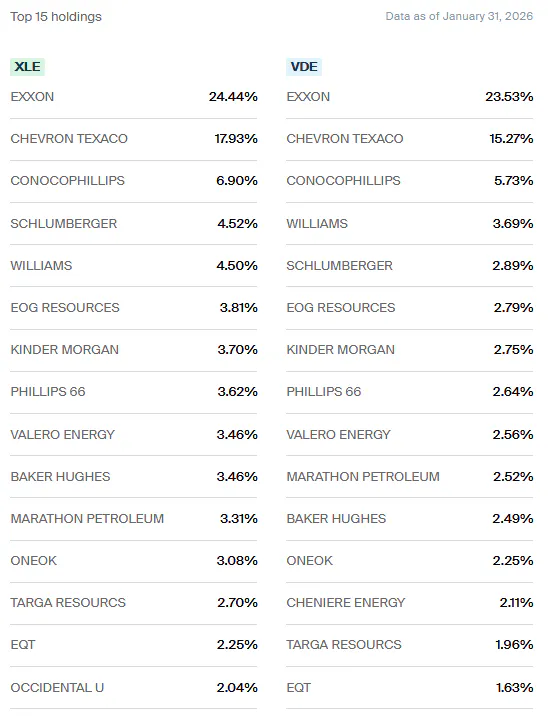
One notable omission in both ETFs is master limited partnerships. While ETFs can hold up to 25% in MLPs and still maintain regulated investment company status, doing so introduces tax complexity and potential cost drag. Most broad energy ETFs avoid this entirely, leaving investors to seek separate exposure if desired.
Verdict: VDE stands out for its broader diversification. You still get meaningful exposure to the dominant supermajors, but with added participation from mid- and small-cap energy companies. That wider net can provide more balanced exposure across the sector without being overly concentrated at the top.
XLE vs. VDE: Risk and Return
Both ETFs come with long enough track records to properly evaluate performance across cycles. XLE is the older of the two, dating back to December 1998, while VDE launched in September 2004.
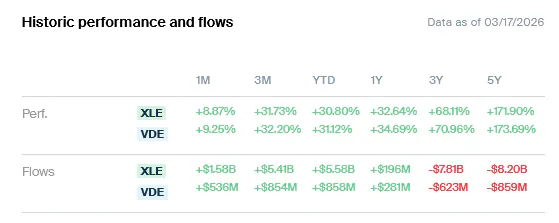
Over the past one-, three-, and five-year periods, both ETFs have delivered strong results, with VDE holding a slight edge in annualized total returns. That said, flows tell a slightly different story. Over the past three and five years, energy has largely been out of favor, and both ETFs have seen outflows.
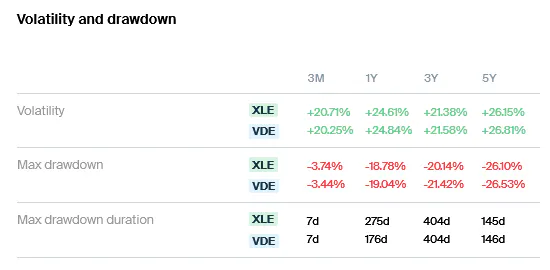
On the risk side, there is very little separation. Annualized volatility across one-, three-, and five-year periods is nearly identical between the two, as are maximum drawdowns and the timing of those drawdowns. That should not be surprising given the high degree of overlap in holdings and the shared exposure to the same underlying commodity cycles.
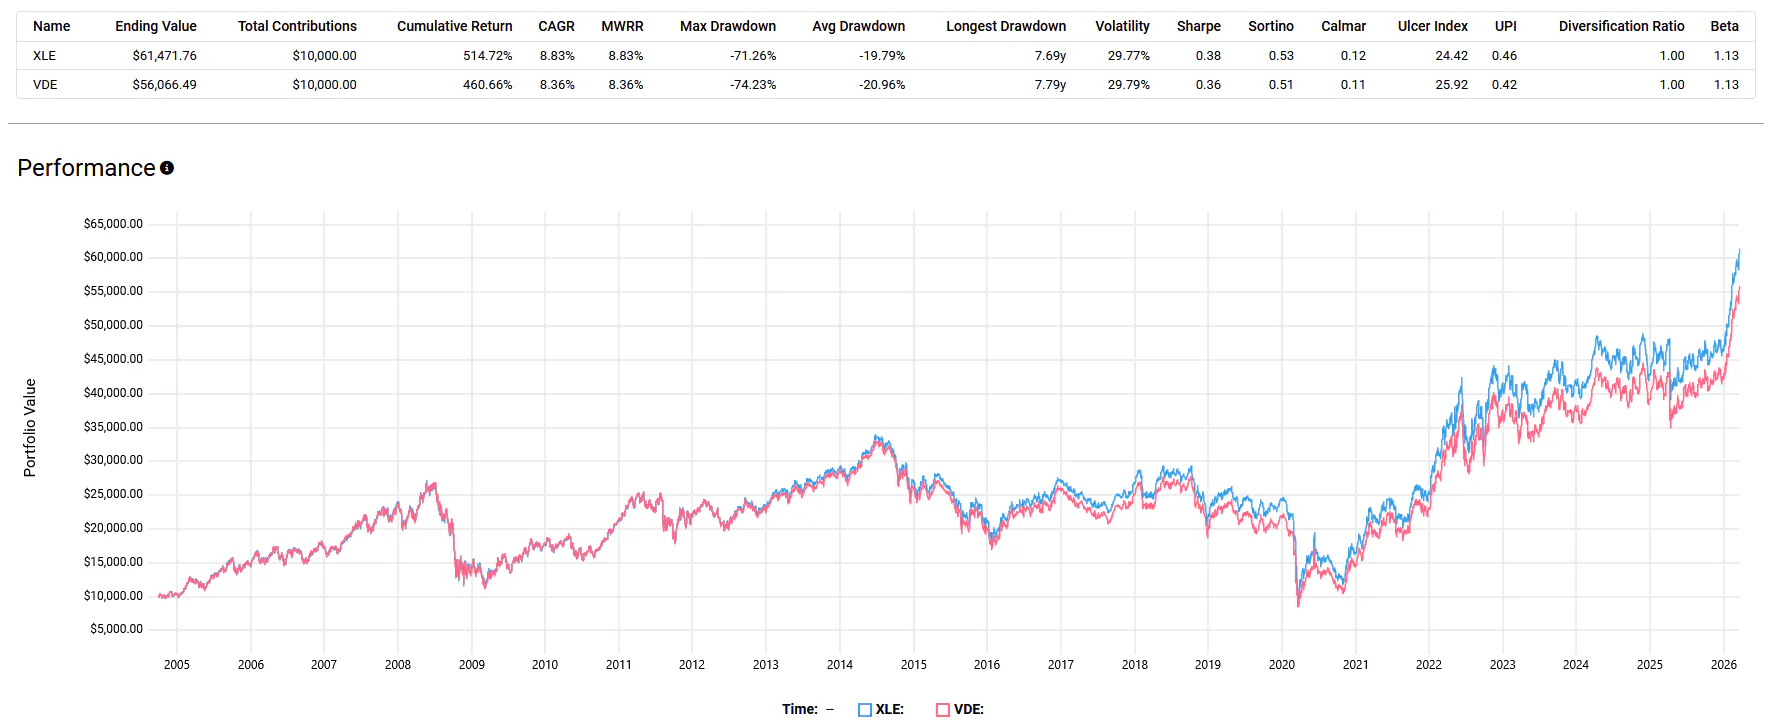
Looking over a longer horizon helps differentiate them slightly. Using a testfolio.io backtest from September 2004 through March 2026, XLE comes out ahead with an annualized return of 8.83% compared to 8.36% for VDE. The most likely explanation is its tighter focus on large-cap, well-capitalized energy companies within the S&P 500.
Verdict: XLE gets the edge, but only by a hair. VDE remains a strong alternative, and in practice, the two can be used almost interchangeably, including as tax-loss harvesting partners.
Please note this article is for information purposes only and does not in any way constitute investment advice. It is essential that you seek advice from a registered financial professional prior to making any investment decision.
Segments
See all
Mentioned ETFs
Further reading

Latest ETF News
See all ETF newsTrump Accounts: Here's Which ETFs You Can Invest In

The Two Best Types of Fixed-Income ETFs For Managing Cash

ETF Comparison: Roundhill Generative AI & Technology ETF Versus iShares A.I. Innovation and Tech Active ETF

Crypto Income ETFs: Futures, Options, or Staking?


 Advantages of ETFs over Mutual Funds1/6
Lower Costs
In this guide, we'll explore the advantages of ETFs over mutual funds, giving you valuable insights into why ETFs have gained significant popularity among investors like yourself.
Leveraged ETFs: Unlocking the Potential for Amplified Returns1/6
Understanding Leveraged ETFs
Explore leveraged ETFs: potential for amplified returns & risks. 5 ETFs to consider across equities, commodities & fixed income.
What is a Leveraged ETF?1/6
Introducing Leveraged and Inverse ETFs
In this guide, we'll dive into the world of leveraged ETFs, exploring their definition, mechanics, potential risks, and rewards.
Recent educational content

ETF Trends
ETF Industry KPIs July 20, 2026
This week’s KPI data overview highlights key metrics and trends shaping the ETF landscape.
ETF Trends
ETF Industry KPIs July 13, 2026
This week’s KPI data overview highlights key metrics and trends shaping the ETF landscape.

First Look ETF
First Look ETF: Cash Deployment, Bond, and Hedged ETFs
In this season 6 episode of First Look ETF, Stephanie Stanton examines the latest ETF marketplace trends with NYSE and guests.

ETF Trends
ETF Industry KPIs July 6, 2026
This week’s KPI data overview highlights key metrics and trends shaping the ETF landscape.
Browse all educational columns

The ETF Industry Is Evolving Fast
From AI infrastructure to active strategies, the ETF landscape is shifting. Share your perspective in the 7th Annual Global ETF Survey and get exclusive early access to the final report.
