Open Now: The Global ETF Survey Take the Survey →



ETF Comparison: Schwab U.S. Dividend Equity ETF (SCHD) Versus WisdomTree U.S. Quality Dividend Growth Fund (DGRW)
Two of the most popular and well-performing U.S. dividend ETFs go head-to-head.

Keep up with what matters in ETFs
Get timely ETF insights, market trends, and top ideas straight to your inbox.
Your newsletter subscriptions with us are subject to ETF Central's Privacy Policy and Terms and Conditions.
If you're a dividend investor, both the Schwab U.S. Dividend Equity ETF
In particular, I've profiled the latter numerous times, both on its own and as part of our "Ultimate Guide to Dividend Investing."
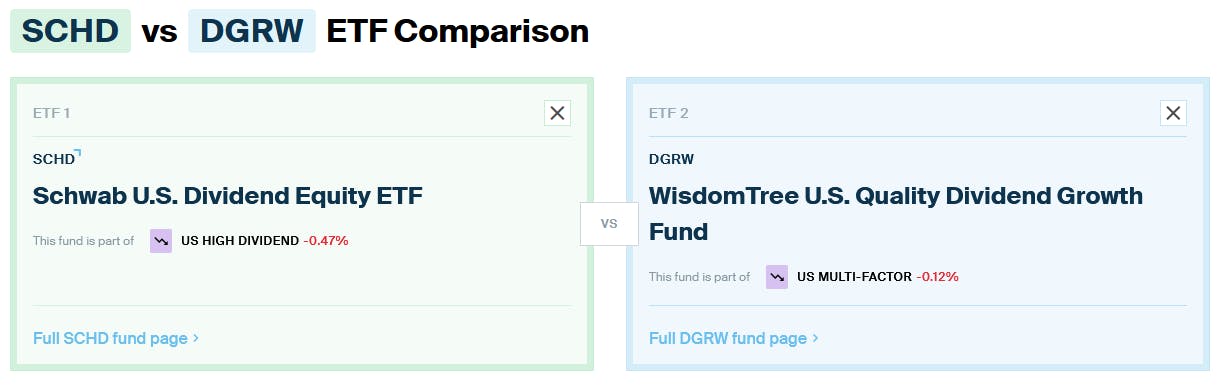
Here's how both ETFs fare head-to-head per the results of the ETF Central comparison tool.
Get data on 14,000+ ETFs
Access Trackinsight's reliable and comprehensive data with 500M+ points on 14,000+ ETFs.
SCHD vs DGRW: Total Cost of Ownership
It's a clean sweep for SCHD in terms of cost. SCHD boasts an expense ratio of just 0.06% compared to DGRW's 0.28%. For a $10,000 investment, that translates to annual fees of $6 for SCHD versus $28 for DGRW.
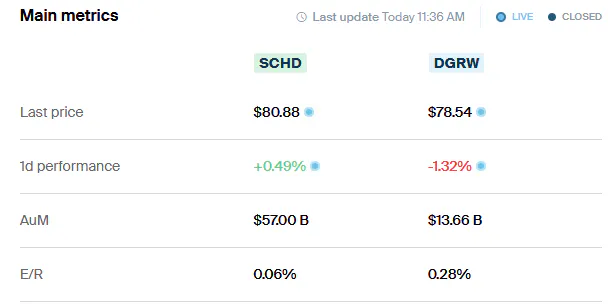
When it comes to trading, SCHD also has the edge with a tighter bid-ask spread of 0.016% compared to DGRW's 0.029%. This means it will cost you less to buy and hold SCHD and less when you decide to sell.
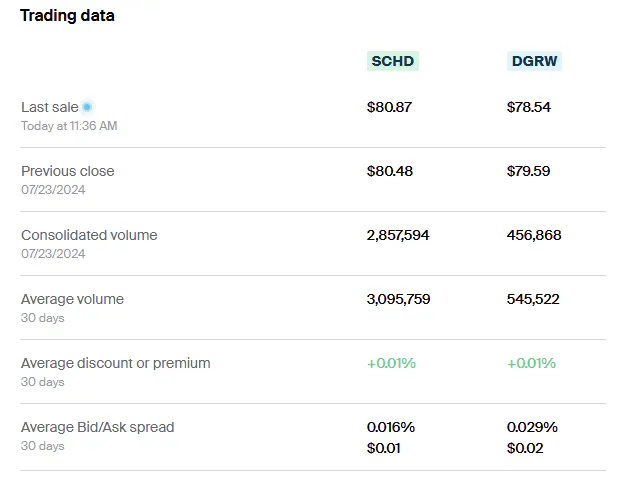
All in all, SCHD wins on the cost front, making it a more cost-effective option for long-term investors.
SCHD vs DGRW: Methodology and Holdings
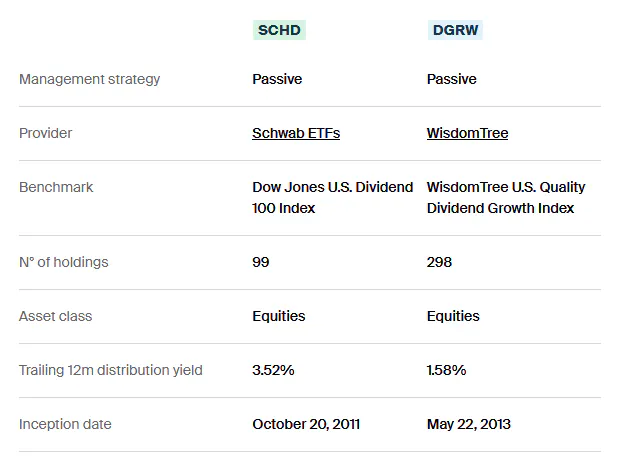
SCHD tracks the Dow Jones U.S. Dividend 100 Index, requiring at least 10 years of consecutive dividend payments with restrictions on minimum market cap and volume.
It employs a composite screener that assesses free cash flow to total debt, return on equity, annual dividend yield, and five-year dividend growth rate. The top 100 stocks are selected for annual reconstitution, resulting in a decent 12-month trailing yield of 3.52%.
DGRW focuses differently, resulting in a 12-month trailing yield of 1.58%. It selects from the WisdomTree U.S. Dividend Index with a minimum market capitalization of $2 billion, ranking the top 300 companies.
This is based on growth (long-term earnings growth expectations) and quality factors (three-year historical averages for return on equity and return on assets). The holdings are fundamentally weighted by projected dividends, not market cap.
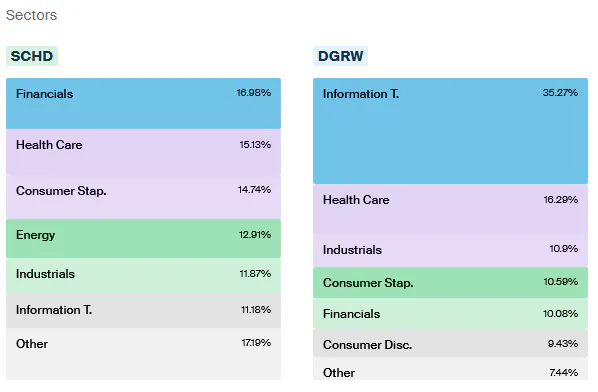
DGRW is more tech-heavy as this sector has higher dividend growth and earnings growth but lower yields. It emphasizes industrials and healthcare sectors. SCHD is heavier on financials and emphasizes consumer staples and energy sectors. Both ETFs exclude real estate due to their index criteria.
DGRW includes more big tech names like Microsoft, Apple, Broadcom, Nvidia, and healthcare giants like Johnson & Johnson, AbbVie, and United Health. SCHD features old-school blue chips like Lockheed Martin, Pfizer, Chevron, Cisco, and Texas Instruments. Both share Coca-Cola, PepsiCo, and Home Depot.
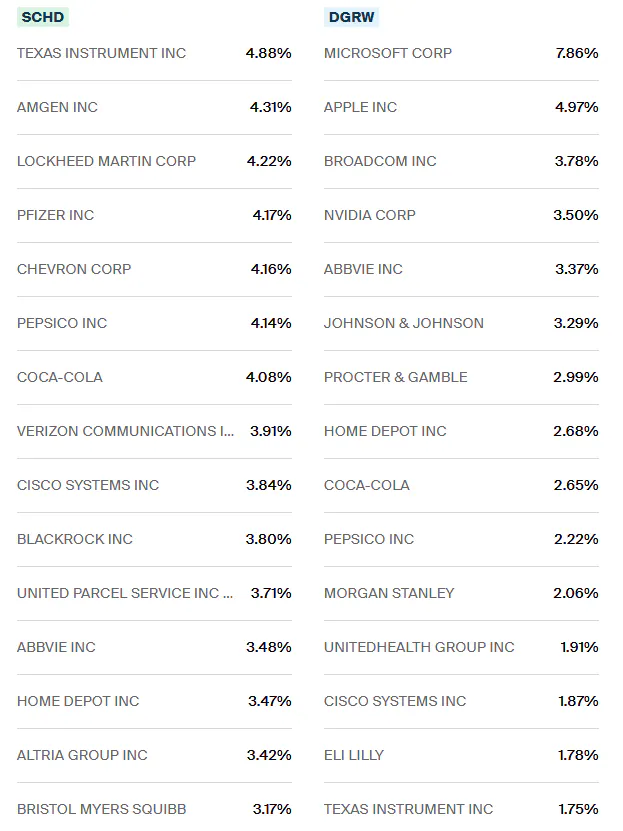
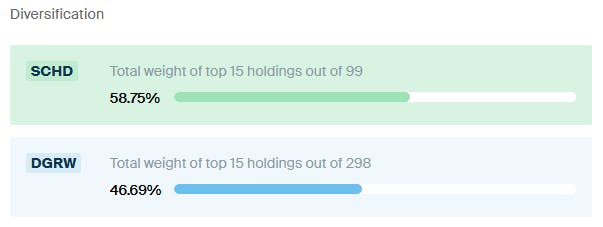
Portfolios change annually during reconstitution, and turnover is fairly high for both at around 28%. SCHD is more top-heavy with its 15 largest holdings accounting for 58.75%, whereas DGRW's top 15 make up 46.69%.
The verdict is mixed. If you want more value-oriented blue chips with a higher yield, SCHD is the way to go. If you prefer a sector composition closer to the market without missing big tech stocks, DGRW wins.
SCHD vs DGRW: Risk and Return
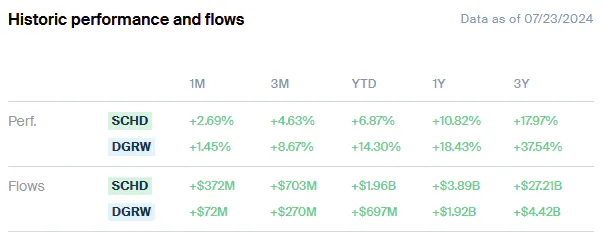
DGRW clearly outperforms in this category, boasting better three-year, one-year, and year-to-date total returns. This success is largely due to its higher concentration of tech and growth stocks, made possible as the ETF's index doesn't impose a minimum yield screen.
In contrast, SCHD's value-focused portfolio, heavily weighted in financials, has been more adversely affected. Interestingly, despite DGRW's superior performance, SCHD has experienced faster growth in terms of size with stronger inflows, indicating more investor interest.
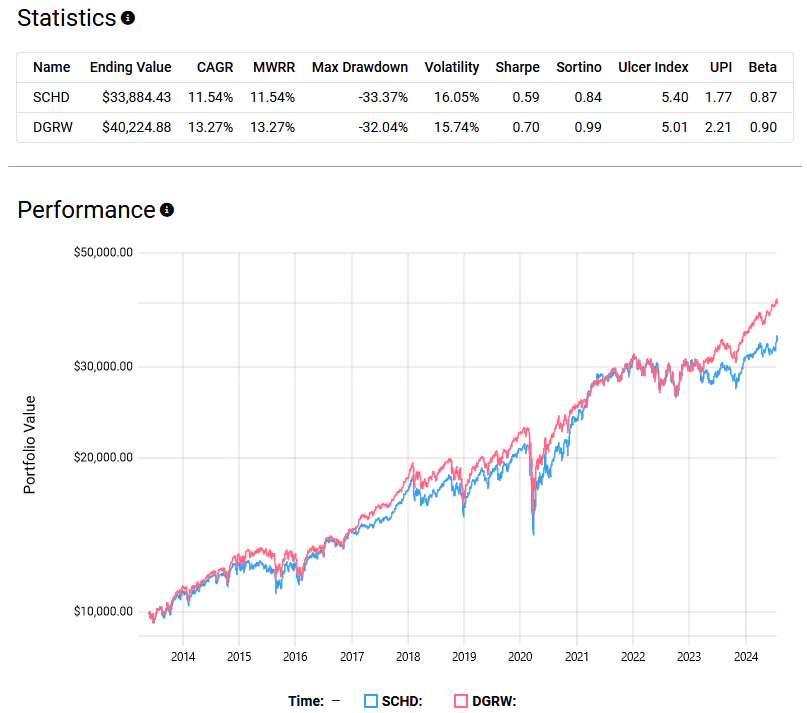
Over a longer backtest starting from 2013, DGRW also comes out on top with higher total and risk-adjusted returns. DGRW really pulled ahead post-2022 when tech stocks surged once again. SCHD performed well during 2022 but stagnated a bit afterwards.
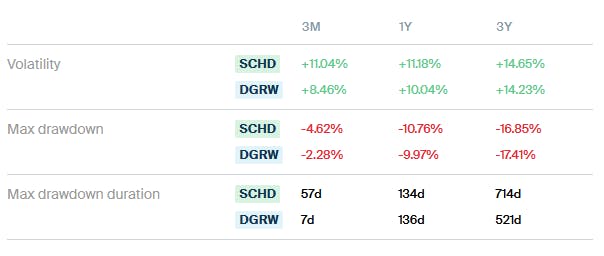
In terms of risk, both ETFs have similar historical volatility with virtually identical standard deviations and maximum drawdowns. However, SCHD's maximum drawdown lasted longer, highlighting that value stocks can remain in a slump for extended periods.
My take? I am wary of high valuations and believe SCHD's screeners do an excellent job of selecting large-cap value stocks with attractive yields, good sector representation, and robust quality at a low fee. Therefore, SCHD is my pick.
However, if you are comfortable with some tech exposure and a lower but still above-average dividend, DGRW is one of the best ETFs available for this role.
Please note this article is for information purposes only and does not in any way constitute investment advice. It is essential that you seek advice from a registered financial professional prior to making any investment decision.
Latest ETF News
See all ETF newsHow Investors can Maximize Tax Efficiency with Income ETFs

Trump Accounts: Here's Which ETFs You Can Invest In

The Two Best Types of Fixed-Income ETFs For Managing Cash

ETF Comparison: Roundhill Generative AI & Technology ETF Versus iShares A.I. Innovation and Tech Active ETF




 Advantages of ETFs over Mutual Funds1/6
Lower Costs
In this guide, we'll explore the advantages of ETFs over mutual funds, giving you valuable insights into why ETFs have gained significant popularity among investors like yourself.
Leveraged ETFs: Unlocking the Potential for Amplified Returns1/6
Understanding Leveraged ETFs
Explore leveraged ETFs: potential for amplified returns & risks. 5 ETFs to consider across equities, commodities & fixed income.
What is a Leveraged ETF?1/6
Introducing Leveraged and Inverse ETFs
In this guide, we'll dive into the world of leveraged ETFs, exploring their definition, mechanics, potential risks, and rewards.
Recent educational content

ETF Trends
ETF Industry KPIs July 20, 2026
This week’s KPI data overview highlights key metrics and trends shaping the ETF landscape.

ETF Trends
ETF Industry KPIs July 13, 2026
This week’s KPI data overview highlights key metrics and trends shaping the ETF landscape.

First Look ETF
First Look ETF: Cash Deployment, Bond, and Hedged ETFs
In this season 6 episode of First Look ETF, Stephanie Stanton examines the latest ETF marketplace trends with NYSE and guests.

ETF Trends
ETF Industry KPIs July 6, 2026
This week’s KPI data overview highlights key metrics and trends shaping the ETF landscape.
Browse all educational columns



The ETF Industry Is Evolving Fast
From AI infrastructure to active strategies, the ETF landscape is shifting. Share your perspective in the 7th Annual Global ETF Survey and get exclusive early access to the final report.