From idea to ETF portfolio in minutes. Build yours now →



ETF comparison: NEOS S&P 500 High Income ETF (SPYI) Versus Goldman Sachs S&P 500 Premium Income ETF (GPIX)
Today’s ETF comparison pits two of the most popular S&P 500 option income ETFs head-to-head.

Keep up with what matters in ETFs
Get timely ETF insights, market trends, and top ideas straight to your inbox.
Your newsletter subscriptions with us are subject to ETF Central's Privacy Policy and Terms and Conditions.
It is the ETF industry acquisition making the rounds recently. On August 12, Goldman Sachs announced that it had agreed to acquire NEOS Investments, which at the time managed approximately $30 billion across 19 options-based ETFs. The price tag was $2.25 billion in cash and equity.
This isn't Goldman's first major move into options-based ETFs either. In April 2026, the firm acquired Innovator Capital Management, best known for pioneering defined-outcome strategies such as buffer ETFs. Innovator brought another roughly $31 billion in assets across 171 ETFs into the fold.
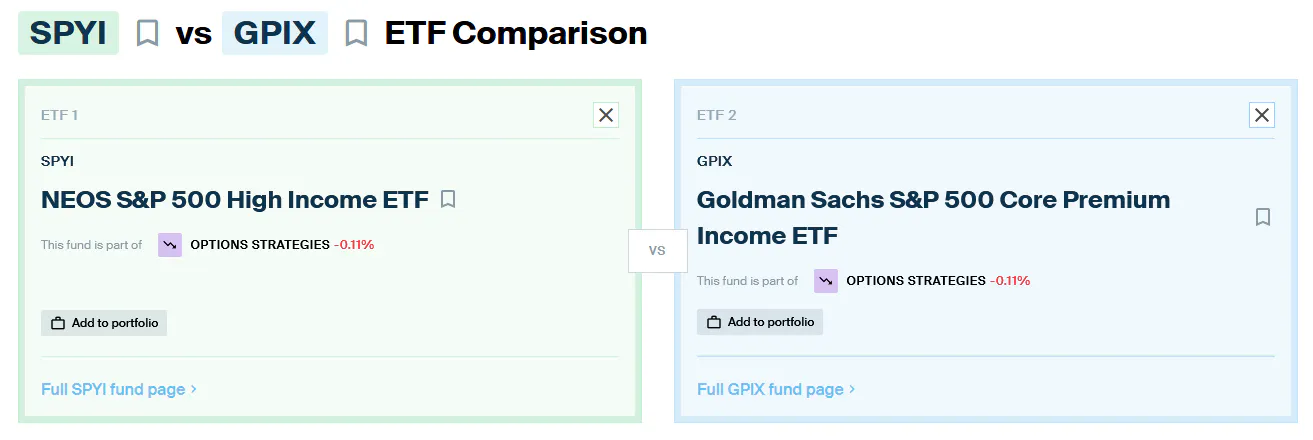
The NEOS acquisition creates an interesting situation because some of the firm's flagship products compete directly against ETFs already offered by Goldman. One of the clearest examples is the NEOS S&P 500 High Income ETF (SPYI), which goes head-to-head with the Goldman Sachs S&P 500 Premium Income ETF (GPIX).
Both combine S&P 500 exposure with an actively managed options overlay designed to generate high monthly income. Using data from the ETF Central Comparison Tool, here's how SPYI and GPIX fare across our usual three categories: total cost of ownership, methodology and exposure, and risk and return.
Get data on 14,000+ ETFs
Access Trackinsight's reliable and comprehensive data with 500M+ points on 14,000+ ETFs.
GPIX vs. SPYI: Total Cost of Ownership
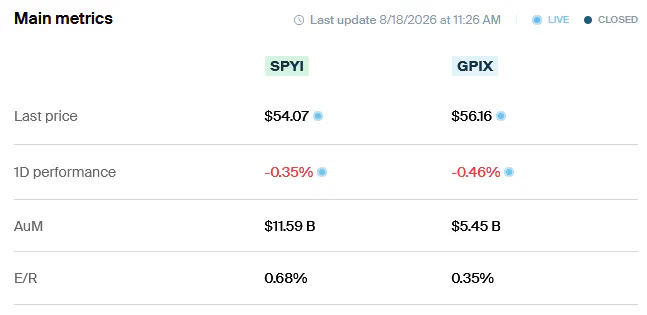
GPIX is among the more competitively priced derivative income ETFs on the market, charging an expense ratio of just 0.35%. SPYI is almost twice as expensive at 0.68%. On a $10,000 investment, that's approximately $35 in annual fund expenses for GPIX compared with $68 for SPYI, all else being equal.
Trading costs tell the opposite story. The bid-ask spread is primarily incurred when entering and exiting a position, while the expense ratio continuously reduces fund returns. SPYI currently has a very tight 30-day average bid-ask spread of just 0.022%, while GPIX is wider at 0.061%.
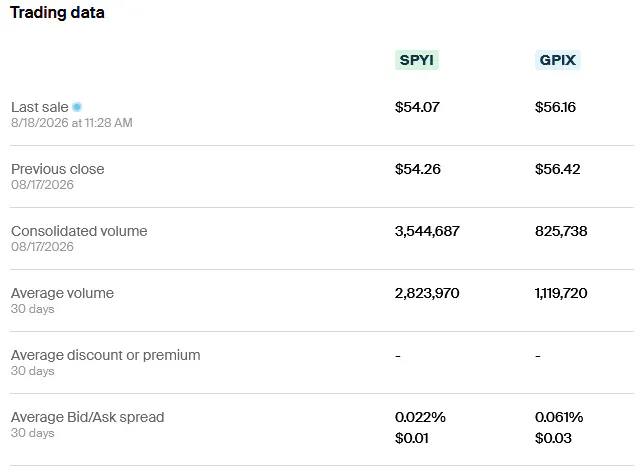
Verdict: GPIX wins on total cost of ownership. SPYI is marginally cheaper to trade, but that advantage isn't enough to overcome a 33-basis-point difference in annual expenses.
GPIX vs. SPYI: Methodology and Exposure
We're going to skip our usual discussion of geographic exposure, sector weights, and individual holdings here. Both strategies are built around the S&P 500, so the more interesting comparison is how they derive, pun intended, their income and how efficiently they distribute it.
SPYI currently has the clear advantage in headline income. Its trailing 12-month distribution rate stands at 11.63%, compared with 8.02% for GPIX. Generally, producing more option income requires either overwriting a greater proportion of the portfolio or selling calls closer to the money. Those choices can increase premium income while sacrificing more upside participation during strong equity rallies.
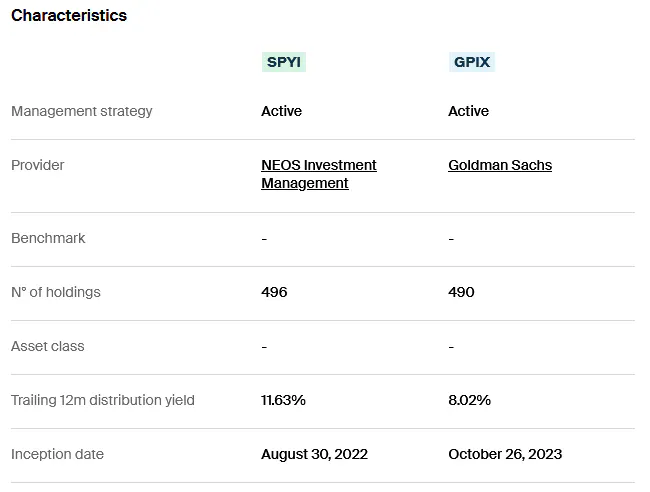
SPYI generates its options income primarily through S&P 500 Index (SPX) options. These are Section 1256 contracts, which receive favorable 60/40 federal tax treatment, with 60% of gains and losses generally treated as long-term and 40% as short-term regardless of the holding period.
Importantly, SPYI isn't limited to a plain-vanilla covered call payoff. The managers can also purchase higher-strike SPX calls after selling lower-strike calls, creating a call spread. The advantage is that upside isn't necessarily capped indefinitely above the short call's strike.
GPIX also writes index call options, but emphasizes a dynamic approach. Rather than following the older model of overwriting 100% of the portfolio with at-the-money calls according to a predetermined monthly schedule, its managers can adjust strike prices, overwrite ratios, and expiration dates.
Both funds have also demonstrated considerable tax efficiency. According to SPYI's July Section 19(a) notice, 99% of its latest distribution was estimated to consist of return of capital (ROC). GPIX wasn't far behind, with 91.5% of its August distribution estimated as ROC. ROC generally isn't immediately taxable when received. Instead, it reduces an investor's cost basis, deferring tax until shares are eventually sold.
Verdict: SPYI gets the win. Both strategies are sophisticated and have demonstrated strong tax efficiency, but investors buying an option-income ETF are generally doing so because they prioritize distributions. SPYI currently delivers substantially more, while its flexible call-spread implementation provides a mechanism for recovering some upside participation. Apparently, Goldman sees something worthwhile in the approach too, considering it just agreed to buy NEOS.
GPIX vs. SPYI: Risk and Return
Neither ETF has an especially long operating history, but their highly comparable mandates make the common performance period useful for evaluating how the two implementations have behaved so far.
On total return, GPIX has held a modest advantage. It has edged out SPYI over the trailing one-year, year-to-date, and three-month periods. Investor flows tell a different story. SPYI has attracted substantially more net inflows, suggesting investors have placed considerable value on its higher distributions. That's worth noting, although total return remains the more important measure.
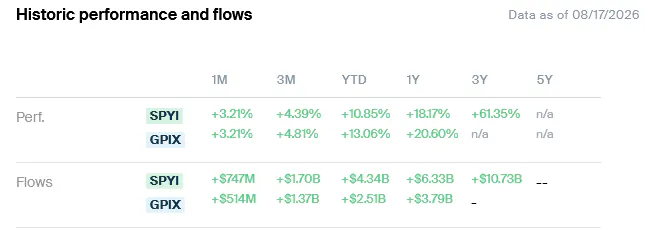
The risk statistics provide relatively little separation between the two funds. Both have exhibited similar volatility, maximum drawdown depth, and drawdown duration over their available common history. That's not particularly surprising as neither ETF is primarily designed as a downside hedge. Option premiums can provide a modest cushion against losses, but both portfolios remain exposed to the S&P 500. If the index experiences a selloff, collected premiums can offset only a portion of those declines.
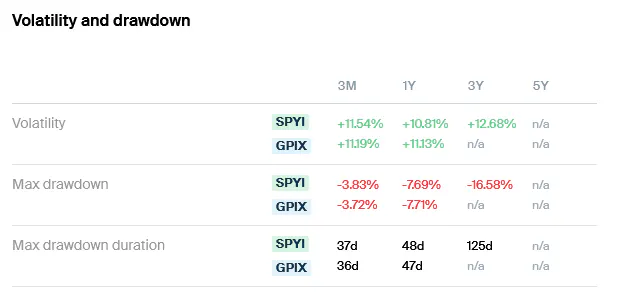
Verdict: GPIX gets the win on risk and return. Its total return has been slightly stronger across the available comparison periods without taking materially greater risk than SPYI. The performance advantage remains modest and the common track record is short, but based on the evidence available today, GPIX is currently in the lead.
Please note that this article reflects the author’s personal views and does not represent the opinions of the publication or its affiliates. It is for informational purposes only and does not constitute investment advice. It is essential to seek guidance from a registered financial professional before making any investment decisions.

Latest ETF News
See all ETF newsThere’s an ETF for That? Investing Like University Endowments

Could Water ETFs Be the Next AI Bottleneck Trade?

What is a Boomer Candy ETF?

ETF Comparison: NEOS Nasdaq-100 High Income ETF (QQQI) Versus Goldman Sachs Nasdaq-100 Premium Income ETF (GPIQ)



 Advantages of ETFs over Mutual Funds1/6
Lower Costs
In this guide, we'll explore the advantages of ETFs over mutual funds, giving you valuable insights into why ETFs have gained significant popularity among investors like yourself.
Leveraged ETFs: Unlocking the Potential for Amplified Returns1/6
Understanding Leveraged ETFs
Explore leveraged ETFs: potential for amplified returns & risks. 5 ETFs to consider across equities, commodities & fixed income.
What is a Leveraged ETF?1/6
Introducing Leveraged and Inverse ETFs
In this guide, we'll dive into the world of leveraged ETFs, exploring their definition, mechanics, potential risks, and rewards.
Recent educational content

ETF Trends
ETF Industry KPIs September 14, 2026
This week’s KPI data overview highlights key metrics and trends shaping the ETF landscape.

ETF Trends
ETF Industry KPIs September 8, 2026
This week’s KPI data overview highlights key metrics and trends shaping the ETF landscape.
ETF Trends
ETF Industry KPIs August 31, 2026
This week’s KPI data overview highlights key metrics and trends shaping the ETF landscape.
ETF Trends
ETF Industry KPIs August 24, 2026
This week’s KPI data overview highlights key metrics and trends shaping the ETF landscape.
Browse all educational columns



Build and Analyze Your ETF Portfolio Like a Pro
Create your own ETF portfolio in minutes and instantly see allocations, exposures, performance, and risk. Visualize diversification across asset classes, regions, and sectors. Stress-test ideas, compare benchmarks, and refine your strategy with professional-grade analytics.
