Create, analyze, optimize your ETF portfolio. Start now →



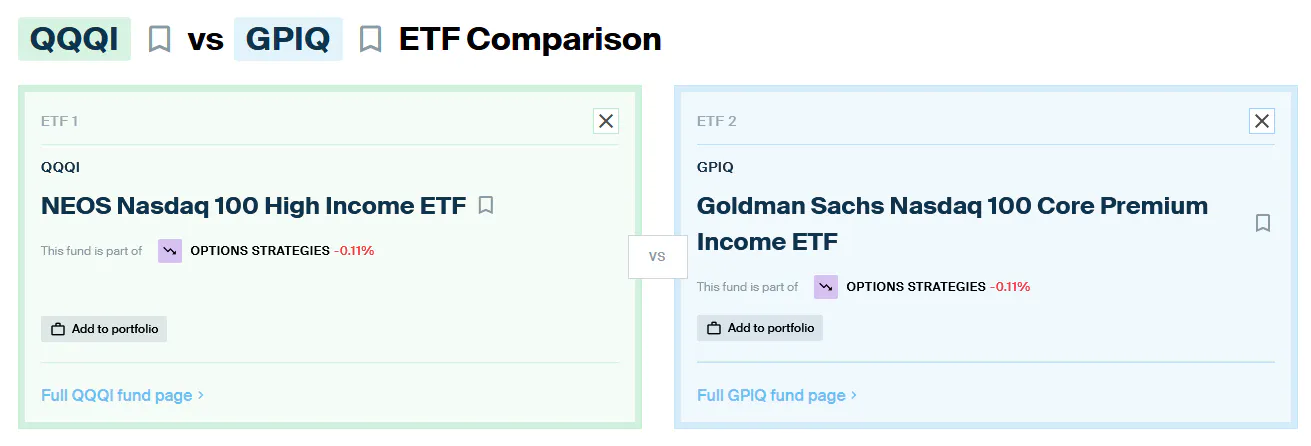
ETF Comparison: NEOS Nasdaq-100 High Income ETF (QQQI) Versus Goldman Sachs Nasdaq-100 Premium Income ETF (GPIQ)
Two Nasdaq-100 based option income ETFs go head-to-head in this week’s ETF comparison.

Keep up with what matters in ETFs
Get timely ETF insights, market trends, and top ideas straight to your inbox.
Your newsletter subscriptions with us are subject to ETF Central's Privacy Policy and Terms and Conditions.
Goldman Sachs' recently announced acquisition of NEOS Investments creates another interesting overlap within its ETF lineup. Once the $2.25 billion transaction closes, Goldman will own two funds competing for essentially the same investor: the NEOS Nasdaq-100 High Income ETF
It's not difficult to see why both firms targeted the Nasdaq-100 for derivative income. The index sits at the intersection of two characteristics options managers love: liquidity and volatility. Nasdaq-100 index products have deep options markets with plenty of strikes and expirations available, while the underlying mega-cap growth and technology stocks can translate into richer premiums for managers selling calls.
Now Goldman is set to have two different implementations of that same basic idea under one roof. QQQI and GPIQ start with similar Nasdaq-100 exposure but differ in their fees, options implementation, distribution characteristics, and historical results.
Using data from the ETF Central Comparison Tool, let's see which one comes out ahead across our usual three categories: total cost of ownership, methodology and exposure, and risk and return.
Get data on 14,000+ ETFs
Access Trackinsight's reliable and comprehensive data with 500M+ points on 14,000+ ETFs.
QQQI vs. GPIQ: Total Cost of Ownership
The first category produces a clear split between management fees and trading costs. GPIQ is considerably cheaper to hold, with a 0.35% expense ratio compared with 0.68% for QQQI. On every $10,000 invested, that's roughly $35 versus $68 in annual fund expenses.
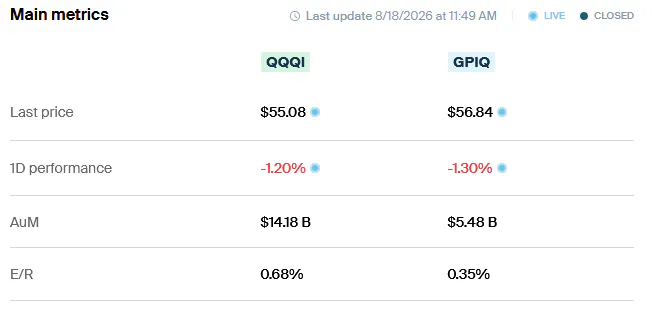
QQQI makes up some ground when it comes time to trade. Its 30-day average bid-ask spread is an exceptionally tight 0.018%, compared with 0.056% for GPIQ. Both remain quite liquid in practical terms, but QQQI currently provides the better execution environment.
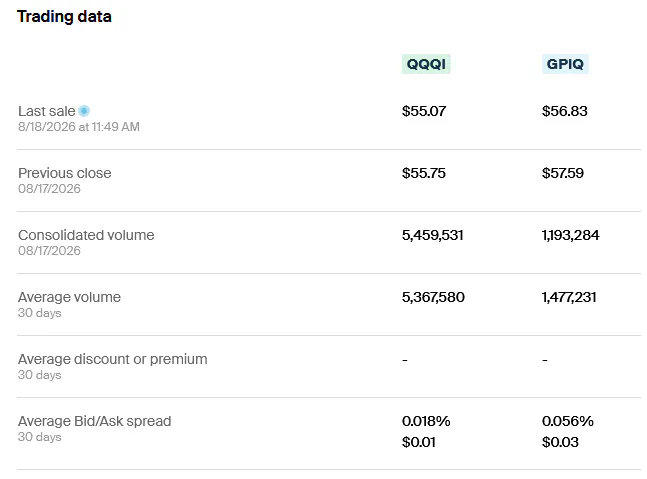
Verdict: GPIQ takes the cost category. QQQI has the tighter spread, but GPIQ's 33-basis-point annual expense-ratio advantage is difficult to overcome for anyone planning to hold the ETF long-term.
QQQI vs. GPIQ: Methodology and Exposure
There isn't much reason to dwell on the underlying equity exposure. Both funds are built around the Nasdaq-100, so investors should already know what they're signing up for: a concentrated, top-heavy portfolio dominated by mega-cap growth companies with a substantial technology sector bias. The more useful distinction is how each manager converts that volatile equity exposure into distributions.
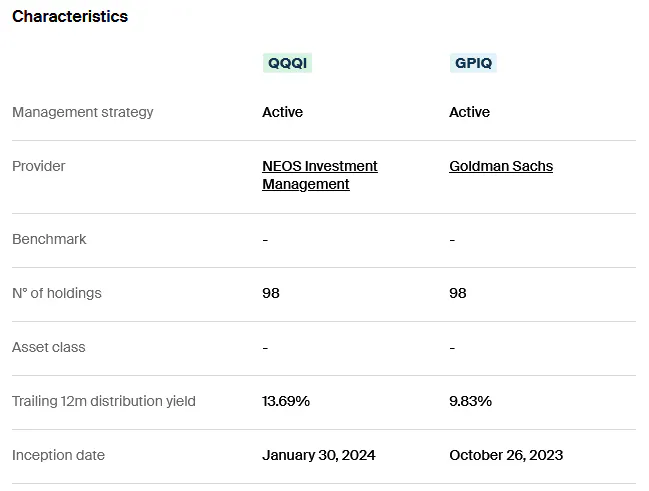
QQQI uses Nasdaq-100 Index (NDX) options as part of its actively managed overlay. These index options generally qualify as Section 1256 contracts, giving realized gains and losses 60% long-term and 40% short-term capital gains treatment for federal tax purposes regardless of the actual holding period. NEOS can also actively realize losses elsewhere in the portfolio to help manage taxable gains.
GPIQ likewise maintains an actively managed options program rather than mechanically selling the same calls every month. Goldman can adjust variables such as strike selection, expiration, and the percentage of equity exposure overwritten as market conditions change.
Where both strategies have particularly distinguished themselves is the character of their distributions. According to QQQI's latest Section 19(a) notice, an estimated 100% of its most recent distribution was classified as return of capital (ROC). GPIQ was close behind at approximately 97.2%.
ROC generally defers rather than immediately triggers taxation, reducing an investor's cost basis until shares are eventually sold. That can make a substantial difference compared with receiving the same headline distribution as ordinary income in a taxable brokerage account.
Verdict: QQQI gets a narrow win. Both funds have demonstrated impressive distribution tax efficiency, but QQQI's estimated 100% ROC on its latest payout gives NEOS the slight advantage. For investors deliberately seeking Nasdaq-100 exposure packaged into a tax-conscious income strategy, that is exactly the type of outcome the fund is designed to produce.
QQQI vs. GPIQ: Risk and Return
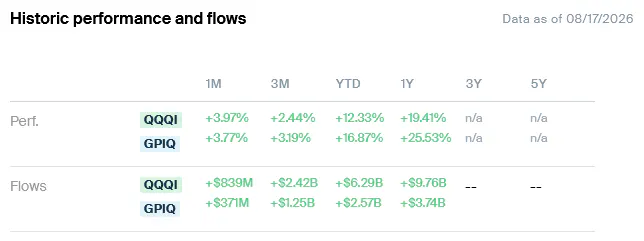
The performance comparison shifts the advantage back toward Goldman. Across their available common history, GPIQ has generated stronger total returns than QQQI. It has also attracted greater net inflows over the period, suggesting investors have responded positively to the combination of lower fees, substantial distributions, and stronger recent performance.
What's interesting is that GPIQ hasn't needed to assume noticeably greater risk to produce those results. The two funds have displayed very similar realized volatility, which makes sense given their shared Nasdaq-100 foundation. Maximum drawdown depth has likewise been close, as has the amount of time each strategy has spent recovering from its declines. Selling calls changes the distribution and payoff profile, but it doesn't turn the Nasdaq-100 into a defensive asset.
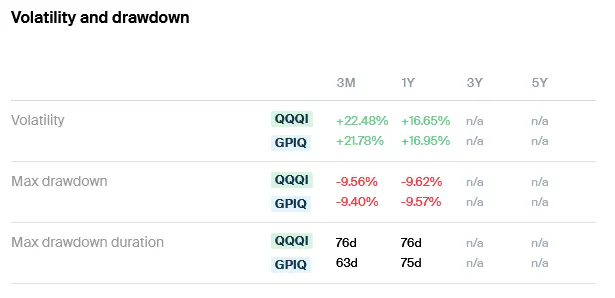
Verdict: GPIQ wins the risk-and-return category. It has delivered stronger total returns over the available comparison period while exhibiting broadly comparable volatility and drawdown characteristics. Combined with its lower expense ratio and stronger recent inflows, that gives Goldman a compelling case despite QQQI's advantage in distribution tax efficiency.
Please note that this article reflects the author’s personal views and does not represent the opinions of the publication or its affiliates. It is for informational purposes only and does not constitute investment advice. It is essential to seek guidance from a registered financial professional before making any investment decisions.
Latest ETF News
See all ETF newsETF Comparison: Vanguard Total World Stock ETF (VT) Versus Dimensional World Equity ETF (DFAW)

ETF Comparison: NEOS Russell 2000 High Income ETF (IWMI) Versus Global X Russell 2000 Covered Call ETF (RYLD)


 Advantages of ETFs over Mutual Funds1/6
Lower Costs
In this guide, we'll explore the advantages of ETFs over mutual funds, giving you valuable insights into why ETFs have gained significant popularity among investors like yourself.
Leveraged ETFs: Unlocking the Potential for Amplified Returns1/6
Understanding Leveraged ETFs
Explore leveraged ETFs: potential for amplified returns & risks. 5 ETFs to consider across equities, commodities & fixed income.
What is a Leveraged ETF?1/6
Introducing Leveraged and Inverse ETFs
In this guide, we'll dive into the world of leveraged ETFs, exploring their definition, mechanics, potential risks, and rewards.
Recent educational content

ETF Trends
ETF Industry KPIs October 5, 2026
This week’s KPI data overview highlights key metrics and trends shaping the ETF landscape.

ETF Trends
ETF Industry KPIs September 28, 2026
This week’s KPI data overview highlights key metrics and trends shaping the ETF landscape.
ETF Trends
ETF Industry KPIs September 22, 2026
This week’s KPI data overview highlights key metrics and trends shaping the ETF landscape.
First Look ETF
First Look ETF: Income, Corporate Arbitrage, and Growth and Value Investing
First Look ETF September 2026: iCapital, Mast Investments and North Square unpack new ETFs targeting monthly income, merger arbitrage and complementary growth and value exposure.

Browse all educational columns



Expert-Built ETF Portfolios, All in One Place
Don’t start from scratch. Discover ready-made ETF portfolios built by professionals to match different goals, timelines, and market views. Use them as inspiration or as a starting point for your own allocation.