Keep tabs on your favorite ETFs with a personalized weekly tracker. Create a Watchlist now →



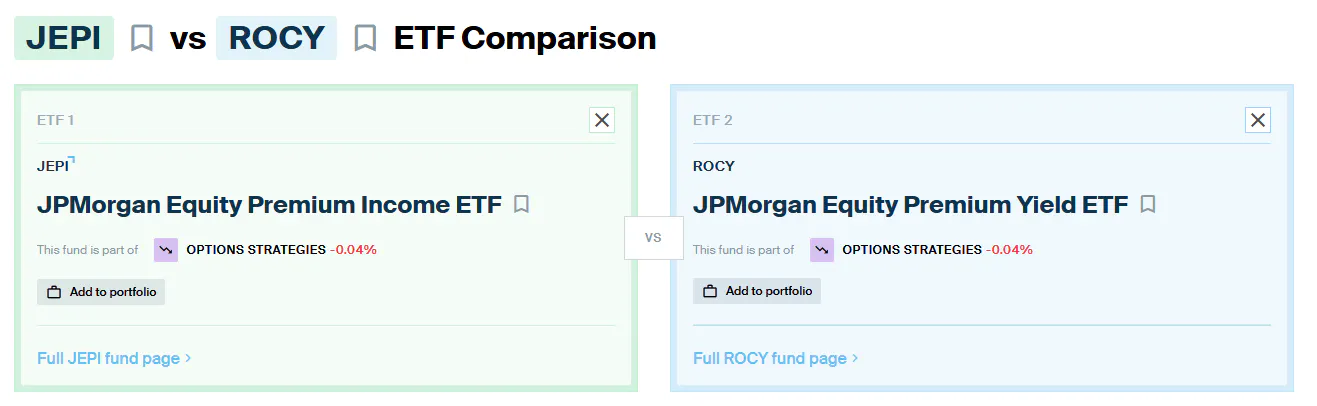
ETF Comparison: JPMorgan Equity Premium Income ETF (JEPI) Versus JPMorgan Equity Premium Yield ETF (ROCY)
JPMorgan Asset Management offers two competing derivative income ETFs with different methodologies and tax efficiency. Here’s our take on how they fare head-to-head.


Keep up with what matters in ETFs
Get timely ETF insights, market trends, and top ideas straight to your inbox.
Your newsletter subscriptions with us are subject to ETF Central's Privacy Policy and Terms and Conditions.
The JPMorgan Equity Premium Income ETF
However, the derivative income category has continued to evolve. In particular, newer competitors from firms such as NEOS Investments have emphasized tax efficiency alongside high monthly distributions. JPMorgan Asset Management recently responded with a companion strategy of its own: the JPMorgan Equity Premium Yield ETF
The first difference you'll probably notice is right there in the name. JEPI emphasizes "income," while ROCY emphasizes "yield." That's not an accident. Neither is ROCY's ticker, which is a clever nod to return of capital (ROC), an important part of how the fund seeks to deliver tax-efficient distributions.
JEPI and ROCY share plenty of similarities. Both are actively managed, both combine an equity portfolio with an options overlay, and both are designed for investors seeking regular distributions. However, there are also some major differences beneath the surface that aren't immediately obvious from their names.
Using data from the ETF Central comparison tool, we'll put JEPI and ROCY head-to-head across our usual three categories: total cost of ownership, methodology and exposure, and risk and return.
Global ETF Survey 2026 is Live!
With 1,790 new products launched by July 2026, choosing is harder than ever. Our Global ETF Survey 2026, built on 620 professional investors and allocators, shows how active, fixed income, options-based and thematic ETFs are reshaping fund selection.
JEPI vs. ROCY: Total Cost of Ownership
Despite being actively managed on both the stock-selection and options sides of their portfolios, JEPI and ROCY are surprisingly affordable. Both charge a 0.35% expense ratio, equivalent to approximately $35 in annual management fees on a $10,000 investment, all else being equal.
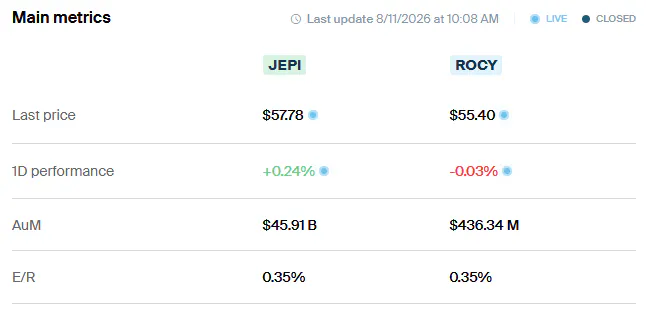
Expense ratios, however, aren't the only cost ETF investors face. The bid-ask spread represents another implicit cost whenever shares are purchased or sold. This is where JEPI's much larger asset base, longer operating history, and heavier trading volume give it an advantage. JEPI currently sports a 30-day average bid-ask spread of just 0.027%. ROCY's spread is considerably wider at 0.109%.
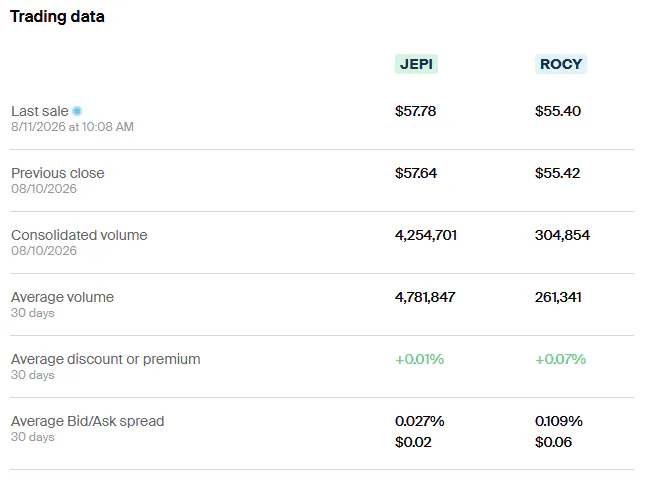
Verdict: JEPI wins on total cost of ownership. Both ETFs charge the same 0.35% expense ratio, but JEPI's substantially tighter bid-ask spread gives it the edge on trading costs. ROCY may narrow that gap as it gathers assets and trading volume, but for now, JEPI is the cheaper of the two to transact.
JEPI vs. ROCY: Methodology and Exposure
Neither JEPI nor ROCY tracks an index. Both are actively managed strategies led by Hamilton Reiner, but their approaches to stock selection and options writing are quite different.
Starting with JEPI, the fund maintains an actively curated portfolio of large-cap U.S. stocks selected partly for defensive characteristics, particularly lower historical volatility. Rather than closely replicating the S&P 500, the managers have considerable discretion to select and weight companies they believe can provide attractive risk-adjusted returns with less volatility than the broader market.
The income overlay is equally distinctive. JEPI allocates up to roughly 15% of its portfolio to equity-linked notes (ELNs), which are structured instruments designed to deliver the economic payoff of an approximately one-month, out-of-the-money S&P 500 covered call strategy. This allows JEPI to monetize volatility in the broader index without writing calls directly against its individual stock holdings.
ROCY takes a different approach. Although it is also actively managed, its stock holdings and weights more closely resemble the S&P 500. Instead of ELNs, ROCY generates its options exposure using listed call spreads. Currently, those trades primarily use options on the SPDR S&P 500 ETF Trust (SPY), which offers substantial open interest and a wide selection of strikes and expiration dates.
These differing philosophies become readily apparent when comparing portfolio exposures. JEPI has considerably less technology exposure than the S&P 500, reflecting its emphasis on lower-volatility stocks. ROCY stays much closer to the market's existing sector composition and therefore maintains greater exposure to technology and the mega-cap companies that currently dominate the index.
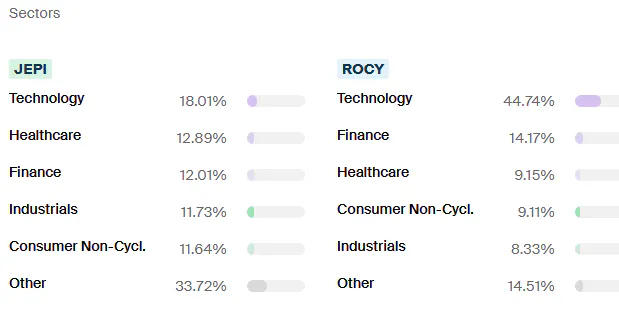
Concentration tells a similar story. JEPI's top 15 holdings account for only about 23% of assets, compared with 40.67% for ROCY. Looking through the individual holdings as of June 30, JEPI's largest positions also bear relatively little resemblance to the S&P 500's market-cap weights. ROCY comes much closer, particularly when it comes to mega-cap exposure.
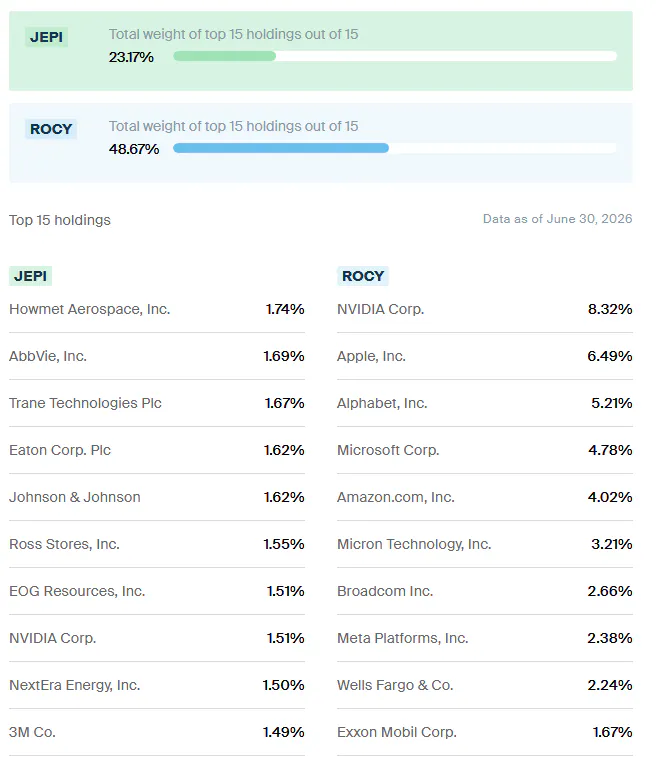
Verdict: I personally still prefer JEPI's methodology. There is an elegant division of labor between the two sides of the strategy: own lower-volatility stocks for defense while using ELNs to monetize volatility from the broader S&P 500. ROCY keeps investors closer to the benchmark while harvesting options premium, which may appeal to those who want to retain more mega-cap growth exposure.
JEPI vs. ROCY: Risk and Return
The performance comparison between JEPI and ROCY is necessarily limited by ROCY's much more recent launch. Still, the short period of common history gives us a few early observations about how the two strategies behave.
Over the trailing three-month period, ROCY has modestly outperformed JEPI, although the difference has not been particularly large. Investor flows have been much more decisive. ROCY attracted approximately $255 million in net inflows over the period, while JEPI experienced roughly $86 million in net outflows.
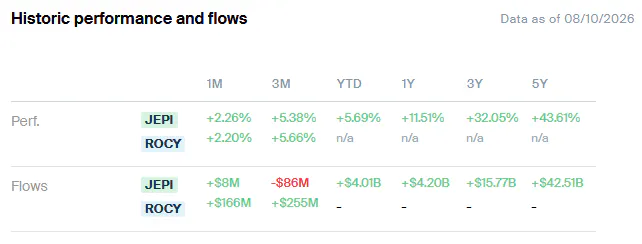
That makes some sense given the current bull market. JEPI's defensive stock selection deliberately sacrifices some upside participation in exchange for lower volatility. When mega-cap growth stocks are leading the market higher, investors may naturally gravitate toward ROCY's greater benchmark resemblance and higher upside capture.
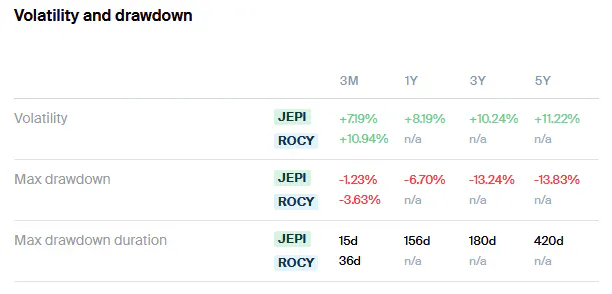
Return, however, is only half of the equation. Risk matters too. Over their limited common history, ROCY has exhibited higher volatility and experienced larger maximum drawdowns than JEPI. That fits with what we saw in their portfolios: JEPI deliberately selects lower-volatility equities, while ROCY maintains greater exposure to the mega-cap growth stocks driving the S&P 500.
There is one additional factor that deserves consideration: tax efficiency. JEPI currently sports an annualized dividend yield of approximately 7.94%, but much of its distributions have historically been characterized as ordinary income. This is partly a consequence of how its options exposure is generated through ELNs. For investors holding JEPI in a taxable brokerage account, that can create meaningful drag.
ROCY appears designed to address this weakness. Its current distribution yield is similar at approximately 7.88%, but recent Section 19(a) notices estimate that a substantial portion of its distributions may consist of return of capital (ROC). Return of capital generally isn't immediately taxable as ordinary income. Instead, it reduces an investor's adjusted cost basis, potentially deferring the tax liability until shares are eventually sold.
There is an important caveat: Section 19(a) notices provide estimates, not final tax classifications. Investors won't know the definitive character of ROCY's 2026 distributions until the fund reports its year-end tax information on Form 1099-DIV.
Verdict: ROCY gets the win here, particularly for investors holding the fund in a taxable account. JEPI has so far delivered the smoother ride, but ROCY offers greater upside participation while targeting a substantially more tax-efficient distribution profile. If its distributions ultimately receive the return-of-capital treatment suggested by recent Section 19(a) notices, that tax deferral could make a meaningful difference to long-term after-tax total returns.
Please note that this article reflects the author’s personal views and does not represent the opinions of the publication or its affiliates. It is for informational purposes only and does not constitute investment advice. It is essential to seek guidance from a registered financial professional before making any investment decisions.
Segments
See all
Mentioned ETFs
Further reading
Latest ETF News
See all ETF newsETF Comparison: Vanguard Total World Stock ETF (VT) Versus Dimensional World Equity ETF (DFAW)

ETF Comparison: NEOS Russell 2000 High Income ETF (IWMI) Versus Global X Russell 2000 Covered Call ETF (RYLD)




 Advantages of ETFs over Mutual Funds1/6
Lower Costs
In this guide, we'll explore the advantages of ETFs over mutual funds, giving you valuable insights into why ETFs have gained significant popularity among investors like yourself.
Leveraged ETFs: Unlocking the Potential for Amplified Returns1/6
Understanding Leveraged ETFs
Explore leveraged ETFs: potential for amplified returns & risks. 5 ETFs to consider across equities, commodities & fixed income.
What is a Leveraged ETF?1/6
Introducing Leveraged and Inverse ETFs
In this guide, we'll dive into the world of leveraged ETFs, exploring their definition, mechanics, potential risks, and rewards.
Recent educational content

ETF Trends
ETF Industry KPIs October 5, 2026
This week’s KPI data overview highlights key metrics and trends shaping the ETF landscape.

ETF Trends
ETF Industry KPIs September 28, 2026
This week’s KPI data overview highlights key metrics and trends shaping the ETF landscape.
ETF Trends
ETF Industry KPIs September 22, 2026
This week’s KPI data overview highlights key metrics and trends shaping the ETF landscape.

First Look ETF
First Look ETF: Income, Corporate Arbitrage, and Growth and Value Investing
First Look ETF September 2026: iCapital, Mast Investments and North Square unpack new ETFs targeting monthly income, merger arbitrage and complementary growth and value exposure.

Browse all educational columns



Build and Analyze Your ETF Portfolio Like a Pro
Create your own ETF portfolio in minutes and instantly see allocations, exposures, performance, and risk. Visualize diversification across asset classes, regions, and sectors. Stress-test ideas, compare benchmarks, and refine your strategy with professional-grade analytics.
